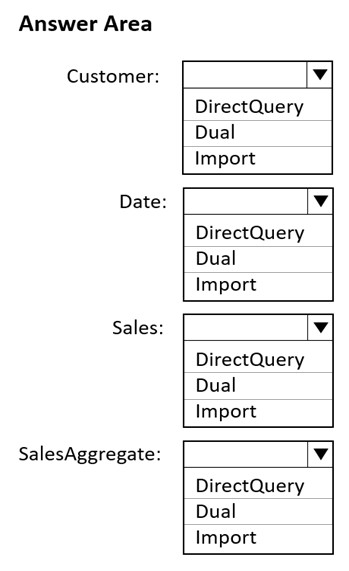
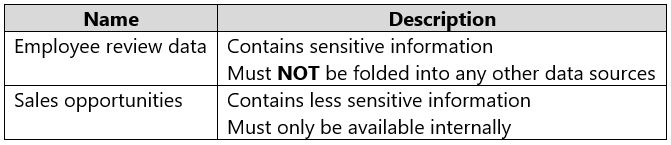
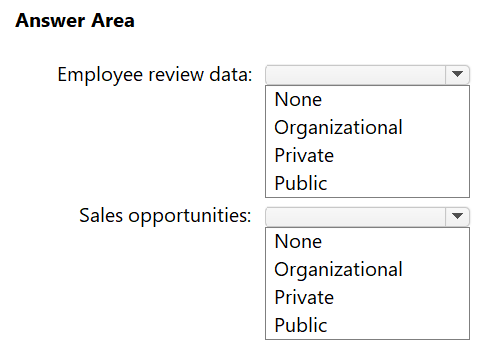
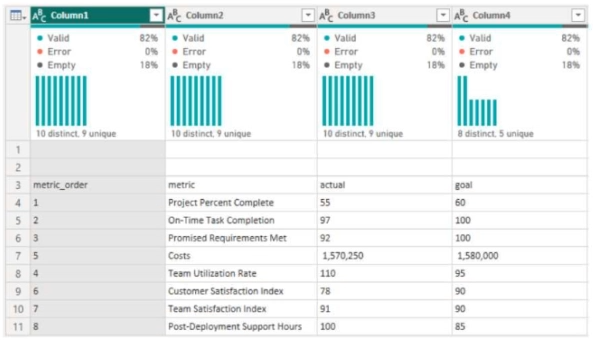
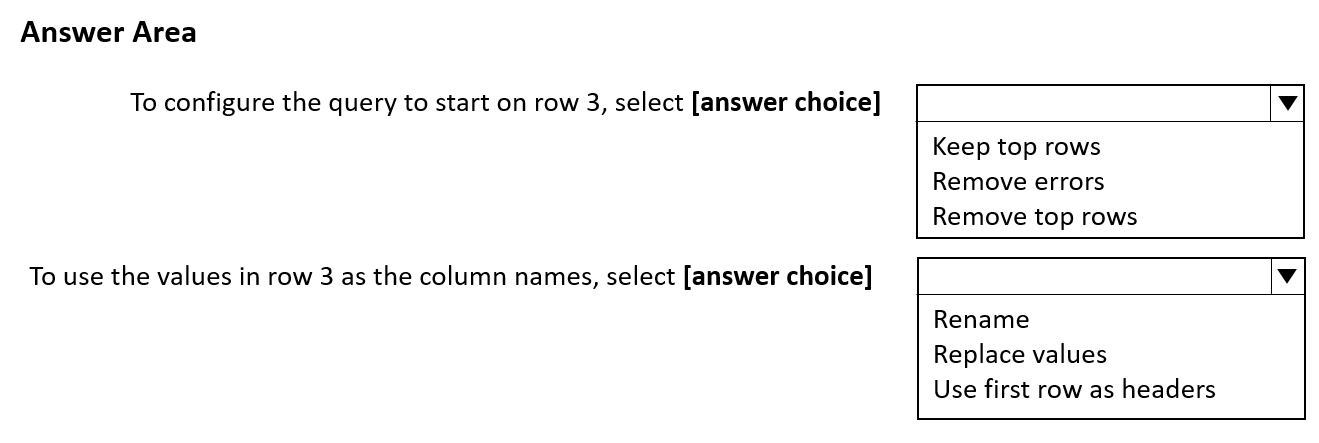
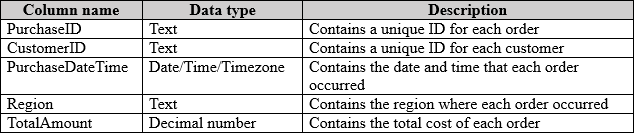
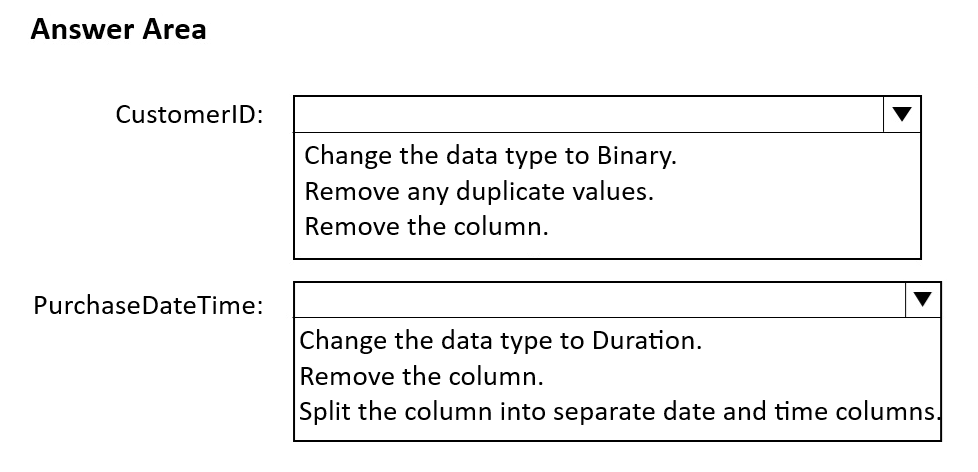
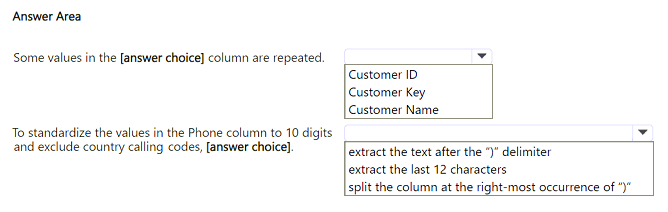
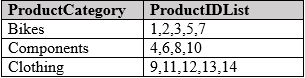
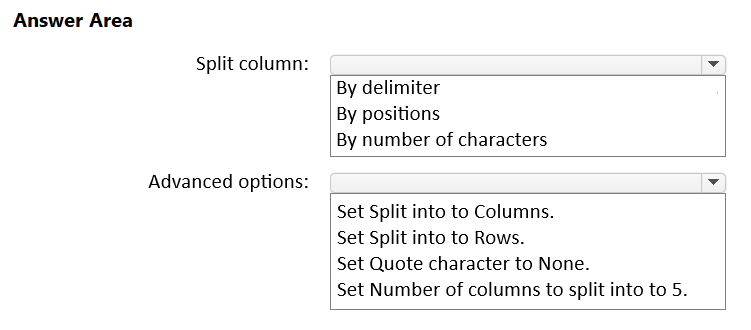
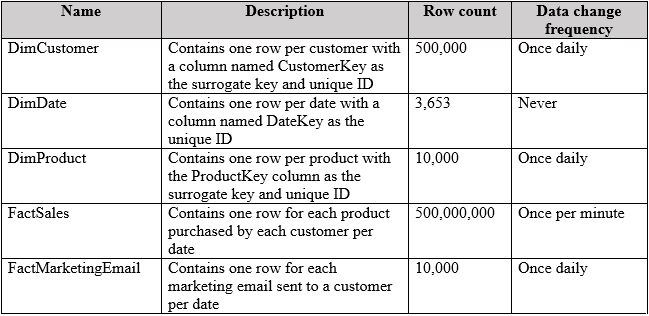
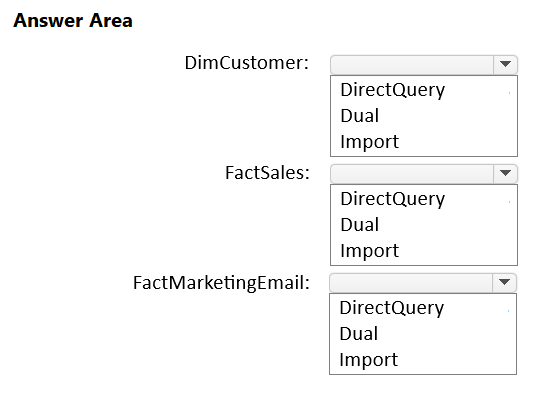
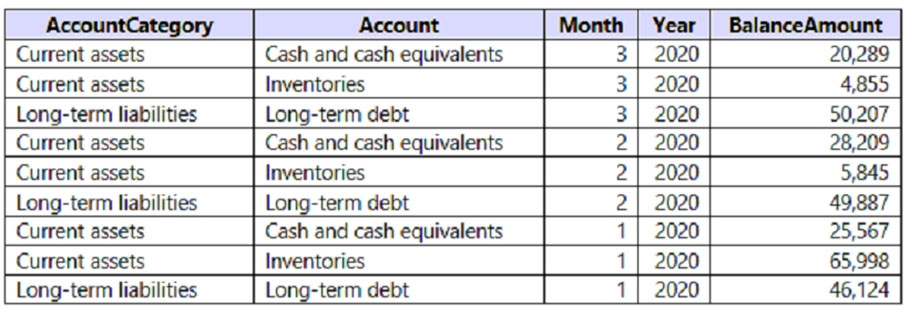
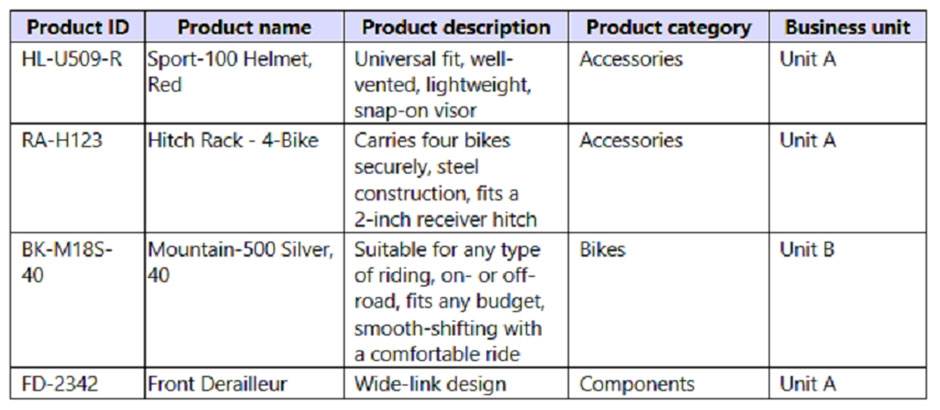
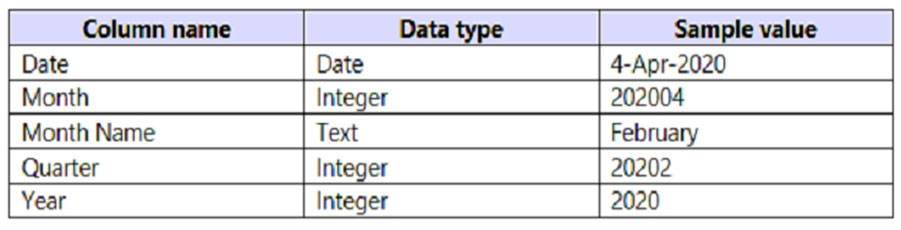
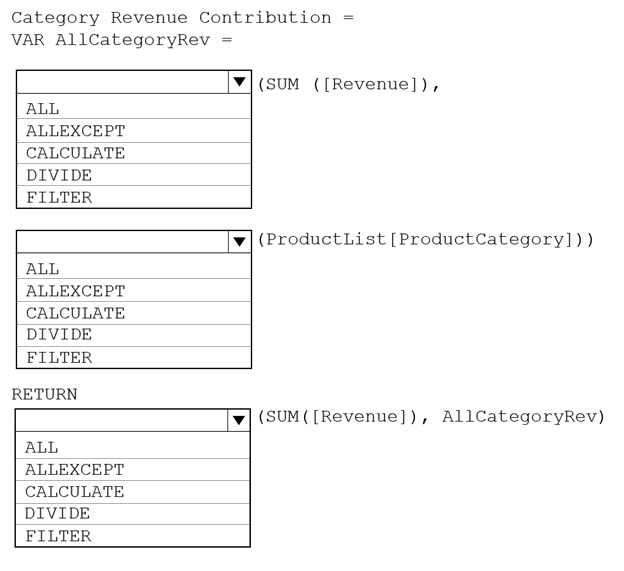
HOTSPOT - You plan to create the Power BI model shown in the exhibit. (Click the Exhibit tab.) The data has the following refresh requirements: ✑ Customer must be refreshed daily. ✑ Date must be refreshed once every three years. ✑ Sales must be refreshed in near real time. ✑ SalesAggregate must be refreshed once per week. You need to select the storage modes for the tables. The solution must meet the following requirements: ✑ Minimize the load times of visuals. ✑ Ensure that the data is loaded to the model based on the refresh requirements. Which storage mode should you select for each table? To answer, select the appropriate options in the answer area. NOTE: Each correct selection is worth one point. Hot Area:
Microsoft Teams で完全にホストされているプロジェクト管理アプリがあります。このアプリは Microsoft Power Apps を使用して開発されました。 プロジェクト管理アプリに接続する Power BI レポートを作成する必要があります。 どのコネクタを選択すべきでしょうか。
A. Microsoft Teams Personal Analytics
B. SQL Server データベース
C. Dataverse
D. データフロー
原文 (English) を表示
You have a project management app that is fully hosted in Microsoft Teams. The app was developed by using Microsoft Power Apps. You need to create a Power BI report that connects to the project management app. Which connector should you select?
A. Microsoft Teams Personal Analytics
B. SQL Server database
C. Dataverse
D. Dataflows
解答: C
ポイント: Power Apps で作られ Teams 内で完結するアプリのデータは Dataverse (Dataverse for Teams) に格納される、という Power Platform のデータ基盤の知識を問う問題です。「どこで動くアプリか」ではなく「データがどこに保存されるか」で接続先を選びます。
A. × 不正解
根拠: 「プロジェクト管理アプリに接続する Power BI レポートを作成する必要があります。」
Teams Personal Analytics は個人の会議時間・勤務時間などの「Teams 利用状況」を分析するためのコネクタです。接続したいのはアプリが保持するプロジェクト管理データなので、対象が違います。「Teams」という単語だけで選ばせようとするひっかけです。
B. × 不正解
根拠: 「Microsoft Teams で完全にホストされている」
「完全に Teams 内でホストされている」という記述が、データが外部の SQL Server ではなく Teams 環境に組み込まれた Dataverse for Teams に保存されていることを意味します。SQL Server コネクタでは、このアプリのデータには到達できません。
C. ○ 正解
根拠: 「このアプリは Microsoft Power Apps を使用して開発されました。」
根拠: 「Microsoft Teams で完全にホストされている」
この 2 つの記述の組み合わせが決め手です。Power Apps 製で Teams 内に完結するアプリのデータは Dataverse (Dataverse for Teams) に格納されます。したがって Power BI からそのデータに接続するコネクタは Dataverse です。
D. × 不正解
根拠: 「プロジェクト管理アプリに接続する Power BI レポートを作成する必要があります。」
データフローは Power BI / Power Platform 側でデータを準備・再利用するための ETL 機能であり、Power Apps アプリのデータの保存場所ではありません。アプリに「接続する」という要件を満たす接続先になり得ません。
Question 3 (Topic 1 / #3) mc
会社の営業部門向けに、Microsoft SharePoint フォルダーにある Microsoft Excel ファイルからデータをインポートする Power BI レポートを発行しています。 データ モデルには複数のメジャーが含まれています。 既存のデータから Power BI レポートを作成する必要があります。ソリューションでは、開発工数を最小限に抑える必要があります。 どの種類のデータ ソースを使用すべきでしょうか。
A. Power BI データセット
B. SharePoint フォルダー
C. Power BI データフロー
D. Excel ブック
原文 (English) を表示
For the sales department at your company, you publish a Power BI report that imports data from a Microsoft Excel file located in a Microsoft SharePoint folder. The data model contains several measures. You need to create a Power BI report from the existing data. The solution must minimize development effort. Which type of data source should you use?
A. Power BI dataset
B. a SharePoint folder
C. Power BI dataflows
D. an Excel workbook
解答: A
ポイント: 既存のモデルとメジャーをそのまま再利用できる接続先は Power BI データセットです。「開発工数を最小限に」という要件が、ゼロから作り直す選択肢を除外して再利用を選ばせるシグナルになっています。
A. ○ 正解
根拠: 「データ モデルには複数のメジャーが含まれています。」
根拠: 「開発工数を最小限に抑える必要があります。」
発行済みレポートの背後には、メジャーを含むデータ モデル (データセット) が既に存在します。Power BI データセットにライブ接続すれば、変換・リレーションシップ・メジャーをすべて再利用でき、新しいレポートの開発工数が最小になります。
Customer と Address という名前の 2 つの Microsoft Excel テーブルを Power Query にインポートします。Customer には次の列が含まれています。 ✑ Customer ID ✑ Customer Name ✑ Phone ✑ Email Address ✑ Address ID Address には次の列が含まれています。 ✑ Address ID ✑ Address Line 1 ✑ Address Line 2 ✑ City ✑ State/Region ✑ Country ✑ Postal Code Customer テーブルの各 Customer ID は一意の顧客を表します。Address テーブルの各 Address ID は一意の住所を表します。 顧客ごとに 1 行を持つクエリを作成する必要があります。各行には、顧客ごとの City、State/Region、Country が含まれている必要があります。 何をすべきでしょうか。
A. Customer テーブルと Address テーブルをマージする。
B. Customer テーブルと Address テーブルを Address ID 列でグループ化する。
C. Customer テーブルと Address テーブルを入れ替える。
D. Customer テーブルと Address テーブルを追加する。
原文 (English) を表示
You import two Microsoft Excel tables named Customer and Address into Power Query. Customer contains the following columns: ✑ Customer ID ✑ Customer Name ✑ Phone ✑ Email Address ✑ Address ID Address contains the following columns: ✑ Address ID ✑ Address Line 1 ✑ Address Line 2 ✑ City ✑ State/Region ✑ Country ✑ Postal Code Each Customer ID represents a unique customer in the Customer table. Each Address ID represents a unique address in the Address table. You need to create a query that has one row per customer. Each row must contain City, State/Region, and Country for each customer. What should you do?
A. Merge the Customer and Address tables.
B. Group the Customer and Address tables by the Address ID column.
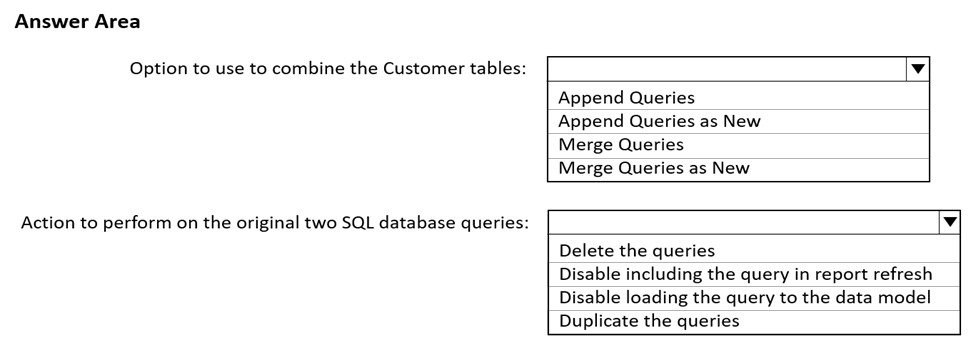
HOTSPOT - You have two Azure SQL databases that contain the same tables and columns. For each database, you create a query that retrieves data from a table named Customer. You need to combine the Customer tables into a single table. The solution must minimize the size of the data model and support scheduled refresh in powerbi.com. What should you do? To answer, select the appropriate options in the answer area. NOTE: Each correct selection is worth one point. Hot Area:
解答: Append Queries as New / Disable loading the query to the data model
DRAG DROP - In Power Query Editor, you have three queries named ProductCategory, ProductSubCategory, and Product. Every Product has a ProductSubCategory. Not every ProductsubCategory has a parent ProductCategory. You need to merge the three queries into a single query. The solution must ensure the best performance in Power Query. How should you merge the tables? To answer, drag the appropriate merge types to the correct queries. Each merge type may be used once, more than once, or not at all. You may need to drag the split bar between panes or scroll to view content. NOTE: Each correct selection is worth one point. Select and Place:
Azure SQL データベース erp1 のデータを使用する Power BI レポートを構築しています。 次のテーブルをインポートします。 次の分析を実行する必要があります。 ✑ 注文の合計金額のメジャーを含む、時系列で販売された注文 販売された製品の属性別の注文 ソリューションでは、レポート内のビジュアルを操作する際の更新時間を最小限に抑える必要があります。 最初に何をすべきでしょうか。
A. Power Query で、Order Line Items クエリと Products クエリをマージする。
B. DAX 関数を使用して、製品カテゴリの一覧を Orders テーブルに追加する計算列を作成する。
C. DAX 関数を使用して、製品ごとの注文数を計算する。
D. Power Query で、Orders クエリと Order Line Items クエリをマージする。
原文 (English) を表示
You are building a Power BI report that uses data from an Azure SQL database named erp1. You import the following tables. You need to perform the following analyses: ✑ Orders sold over time that include a measure of the total order value Orders by attributes of products sold The solution must minimize update times when interacting with visuals in the report. What should you do first?
A. From Power Query, merge the Order Line Items query and the Products query.
B. Create a calculated column that adds a list of product categories to the Orders table by using a DAX function.
C. Calculate the count of orders per product by using a DAX function.
D. From Power Query, merge the Orders query and the Order Line Items query.
注文の合計金額は明細 (画像のとおり Order Line Items が数量と価格を保持) から、時系列は注文ヘッダー (Orders) の日付から得る必要があり、両者を 1 つのファクトにマージすることで初めて「時系列 × 金額」の分析が単一テーブルで成立します。結果として Products をディメンションとするシンプルなスター スキーマになり、ビジュアル操作時のクエリが単純化されて更新時間が最小化されます。これがモデル作りの「最初の」一手です。
Question 8 (Topic 1 / #8) mc
複数のドキュメント ライブラリを含む Microsoft SharePoint Online サイトがあります。 いずれかのドキュメント ライブラリに、Microsoft Excel ファイルとして保存された製造レポートが含まれています。すべての製造レポートは同じデータ構造です。 Power BI Desktop を使用して、製造レポートのみをテーブルに読み込んで分析する必要があります。 何をすべきでしょうか。
A. SharePoint フォルダーからデータを取得し、サイトの URL を入力する。[変換] を選択し、製造レポート ライブラリへのフォルダー パスでフィルター処理する。
B. SharePoint リストからデータを取得し、サイトの URL を入力する。[結合と変換] を選択し、製造レポート ライブラリへのフォルダー パスでフィルター処理する。
C. SharePoint フォルダーからデータを取得し、サイトの URL を入力して、[結合と読み込み] を選択する。
D. SharePoint リストからデータを取得し、サイトの URL を入力して、[結合と読み込み] を選択する。
原文 (English) を表示
You have a Microsoft SharePoint Online site that contains several document libraries. One of the document libraries contains manufacturing reports saved as Microsoft Excel files. All the manufacturing reports have the same data structure. You need to use Power BI Desktop to load only the manufacturing reports to a table for analysis. What should you do?
A. Get data from a SharePoint folder and enter the site URL Select Transform, then filter by the folder path to the manufacturing reports library.
B. Get data from a SharePoint list and enter the site URL. Select Combine & Transform, then filter by the folder path to the manufacturing reports library.
C. Get data from a SharePoint folder, enter the site URL, and then select Combine & Load.
D. Get data from a SharePoint list, enter the site URL, and then select Combine & Load.
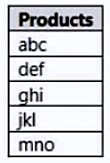
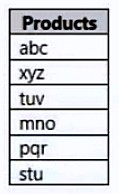
DRAG DROP - You have a Microsoft Excel workbook that contains two sheets named Sheet1 and Sheet2. Sheet1 contains the following table named Table1. Sheet2 contains the following table named Table2. You need to use Power Query Editor to combine the products from Table1 and Table2 into the following table that has one column containing no duplicate values. Which three actions should you perform in sequence? To answer, move the appropriate actions from the list of actions to the answer area and arrange them in the correct order. Select and Place:
解答: From Power BI Desktop, import the data from Excel, and select Table1 and Table2. / From Power Query Editor, append Table2 to Table1. / From Power Query Editor, select Table1, and then select Remove duplicates.
手順 1 → From Power BI Desktop, import the data from Excel, and select Table1 and Table2.
選択肢: From Power Query Editor, remove errors from the table. / From Power Query Editor, select Table1, and then select Remove duplicates. / From Power Query Editor, merge Table1 and Table2. / From Power BI Desktop, import the data from Excel, and select Table1 and Table2. / From Power Query Editor, append Table2 to Table1.
根拠: 「Sheet1 と Sheet2 という名前の 2 つのシートを含む Microsoft Excel ブックがあります。」
まず Power BI Desktop から Excel ブックのデータをインポートし、Table1 と Table2 の両方を選択して Power Query に取り込みます。すべての変換操作はこの取り込みが前提です。
手順 2 → From Power Query Editor, append Table2 to Table1.
選択肢: From Power Query Editor, remove errors from the table. / From Power Query Editor, select Table1, and then select Remove duplicates. / From Power Query Editor, merge Table1 and Table2. / From Power BI Desktop, import the data from Excel, and select Table1 and Table2. / From Power Query Editor, append Table2 to Table1.
手順 3 → From Power Query Editor, select Table1, and then select Remove duplicates.
選択肢: From Power Query Editor, remove errors from the table. / From Power Query Editor, select Table1, and then select Remove duplicates. / From Power Query Editor, merge Table1 and Table2. / From Power BI Desktop, import the data from Excel, and select Table1 and Table2. / From Power Query Editor, append Table2 to Table1.
A. Logged 列の末尾 11 文字を抽出する変換を適用し、新しい列のデータ型を日付に設定する。
B. Logged 列のデータ型を日付に変更する。
C. 区切り記号として at を使用して、Logged 列を分割する。
D. Logged 列の先頭 11 文字を抽出する変換を適用する。
原文 (English) を表示
You have a CSV file that contains user complaints. The file contains a column named Logged. Logged contains the date and time each complaint occurred. The data in Logged is in the following format: 2018-12-31 at 08:59. You need to be able to analyze the complaints by the logged date and use a built-in date hierarchy. What should you do?
A. Apply a transformation to extract the last 11 characters of the Logged column and set the data type of the new column to Date.
B. Change the data type of the Logged column to Date.
C. Split the Logged column by using at as the delimiter.
D. Apply a transformation to extract the first 11 characters of the Logged column.
解答: C
ポイント: 組み込みの日付階層 (年/四半期/月/日) を使うには、列が日付型である必要があります。「2018-12-31 at 08:59」のような文字列からは、区切り記号 at で分割して日付部分を取り出すのが最も確実です。
A. × 不正解
根拠: 「Logged のデータは次の形式です: 2018-12-31 at 08:59。」
「2018-12-31 at 08:59」(19 文字) の末尾 11 文字は「31 at 08:59」で、日付として解釈できない断片です。日付型への設定はエラーになります。抽出すべきは末尾ではなく先頭側です。
Microsoft OneDrive フォルダーに Microsoft Excel ファイルがあります。 このファイルは Power BI データセットにインポートする必要があります。 データセットを powerbi.com で更新できるようにする必要があります。 ファイルへの接続に使用できる 2 つのコネクタはどれですか。それぞれの正解は完全なソリューションを提示します。 注: 正しい選択はそれぞれ 1 ポイントの価値があります。
A. Excel ブック
B. テキスト/CSV
C. フォルダー
D. SharePoint フォルダー
E. Web
原文 (English) を表示
You have a Microsoft Excel file in a Microsoft OneDrive folder. The file must be imported to a Power BI dataset. You need to ensure that the dataset can be refreshed in powerbi.com. Which two connectors can you use to connect to the file? Each correct answer presents a complete solution. NOTE: Each correct selection is worth one point.
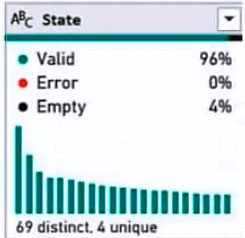
HOTSPOT - You are profiling data by using Power Query Editor. You have a table named Reports that contains a column named State. The distribution and quality data metrics for the data in State is shown in the following exhibit. Use the drop-down menus to select the answer choice that completes each statement based on the information presented in the graphic. NOTE: Each correct selection is worth one point. Hot Area:
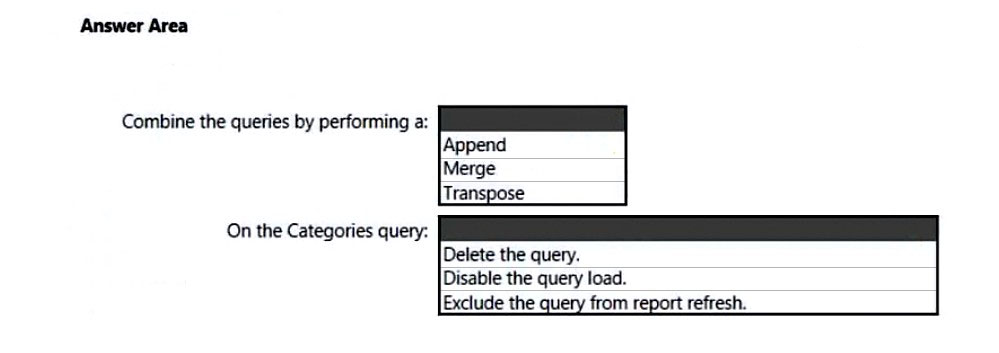
HOTSPOT - You have two CSV files named Products and Categories. The Products file contains the following columns: ✑ ProductID ✑ ProductName ✑ SupplierID ✑ CategoryID The Categories file contains the following columns: ✑ CategoryID ✑ CategoryName ✑ CategoryDescription From Power BI Desktop, you import the files into Power Query Editor. You need to create a Power BI dataset that will contain a single table named Product. The Product will table includes the following columns: ✑ ProductID ✑ ProductName ✑ SupplierID ✑ CategoryID ✑ CategoryName ✑ CategoryDescription How should you combine the queries, and what should you do on the Categories query? To answer, select the appropriate options in the answer area. NOTE: Each correct selection is worth one point. Hot Area:
You have an Azure SQL database that contains sales transactions. The database is updated frequently. You need to generate reports from the data to detect fraudulent transactions. The data must be visible within five minutes of an update. How should you configure the data connection?
ドラッグ アンド ドロップ - 100 個の CSV ファイルを含むフォルダーがあります。 Power BI を使用して、ファイルのメタデータを単一のデータセットとして利用できるようにする必要があります。ソリューションでは、CSV ファイルのデータを保存してはなりません。 どの 3 つの操作を順番に実行すべきでしょうか。回答するには、適切な操作を操作の一覧から回答エリアに移動し、正しい順序に並べてください。 選択と配置:
原文 (English) を表示
DRAG DROP - You have a folder that contains 100 CSV files. You need to make the file metadata available as a single dataset by using Power BI. The solution must NOT store the data of the CSV files. Which three actions should you perform in sequence. To answer, move the appropriate actions from the list of actions to the answer area and arrange them in the correct order. Select and Place:
解答: From Power BI Desktop, select Get Data, and then select Folder. / From Power Query Editor, remove the Content column. / From Power Query Editor, expand the Attributes column.
手順 1 → From Power BI Desktop, select Get Data, and then select Folder.
選択肢: From Power BI Desktop, select Get Data, and then select Folder. / From Power Query Editor, expand the Attributes column. / From Power Query Editor, remove the Content column. / From Power Query Editor, remove the Attributes column. / From Power BI Desktop, select Get Data, and then select Text/CSV. / From Power Query Editor, combine the Content column.
手順 2 → From Power Query Editor, remove the Content column.
選択肢: From Power BI Desktop, select Get Data, and then select Folder. / From Power Query Editor, expand the Attributes column. / From Power Query Editor, remove the Content column. / From Power Query Editor, remove the Attributes column. / From Power BI Desktop, select Get Data, and then select Text/CSV. / From Power Query Editor, combine the Content column.
手順 3 → From Power Query Editor, expand the Attributes column.
選択肢: From Power BI Desktop, select Get Data, and then select Folder. / From Power Query Editor, expand the Attributes column. / From Power Query Editor, remove the Content column. / From Power Query Editor, remove the Attributes column. / From Power BI Desktop, select Get Data, and then select Text/CSV. / From Power Query Editor, combine the Content column.
ビジネス インテリジェンス (BI) 開発者が、DirectQuery を使用してオンプレミスの Microsoft SQL Server のテーブルにアクセスするデータフローを Power BI に作成します。このデータフローでは、強化されたコンピューティング エンジンが有効になっています。 このデータフローをレポートで使用する必要があります。ソリューションは次の要件を満たす必要があります。 ✑ オンライン処理操作を最小限に抑える。 ✑ ビジュアルの計算時間と描画時間を最小限に抑える。 ✑ 今年のデータのうち、前日までのデータを含める。 何をすべきでしょうか。
A. DirectQuery モードを選択したデータフロー接続を作成する。
B. DirectQuery モードを選択したデータフロー接続を作成し、データセットにゲートウェイ接続を構成する。
C. インポート モードを選択したデータフロー接続を作成し、毎日の更新をスケジュールする。
D. インポート モードを選択したデータフロー接続を作成し、データを 1 時間ごとに更新する Microsoft Power Automate ソリューションを作成する。
原文 (English) を表示
A business intelligence (BI) developer creates a dataflow in Power BI that uses DirectQuery to access tables from an on-premises Microsoft SQL server. The Enhanced Dataflows Compute Engine is turned on for the dataflow. You need to use the dataflow in a report. The solution must meet the following requirements: ✑ Minimize online processing operations. ✑ Minimize calculation times and render times for visuals. ✑ Include data from the current year, up to and including the previous day. What should you do?
A. Create a dataflows connection that has DirectQuery mode selected.
B. Create a dataflows connection that has DirectQuery mode selected and configure a gateway connection for the dataset.
C. Create a dataflows connection that has Import mode selected and schedule a daily refresh.
D. Create a dataflows connection that has Import mode selected and create a Microsoft Power Automate solution to refresh the data hourly.
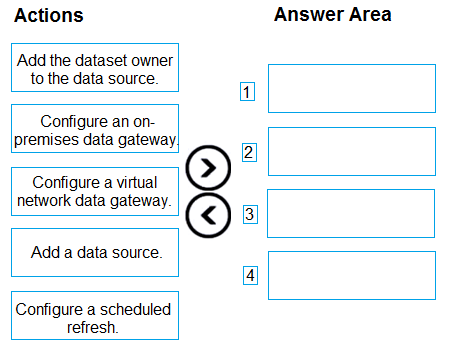
You publish a dataset that contains data from an on-premises Microsoft SQL Server database.
The dataset must be refreshed daily.
You need to ensure that the Power BI service can connect to the database and refresh the dataset.
Which four actions should you perform in sequence? To answer, move the appropriate actions from the list of actions to the answer area and arrange them in the correct order.
解答: Configure an on-premises data gateway. / Add a data source. / Add the dataset owner to the data source. / Configure a scheduled refresh.
選択肢: Add the dataset owner to the data source. / Configure an on-premises data gateway. / Configure a virtual network data gateway. / Add a data source. / Configure a scheduled refresh.
根拠: 「オンプレミスの Microsoft SQL Server データベースのデータを含むデータセットを発行します。」
クラウドの Power BI サービスからオンプレミスのデータベースに到達するには、まずオンプレミス データ ゲートウェイを構成します。仮想ネットワーク データ ゲートウェイは Azure 仮想ネットワーク内のクラウド データ ソース用であり、オンプレミスには使いません。
手順 2 → Add a data source.
選択肢: Add the dataset owner to the data source. / Configure an on-premises data gateway. / Configure a virtual network data gateway. / Add a data source. / Configure a scheduled refresh.
構成したゲートウェイ上に、対象の SQL Server データベースをデータ ソースとして登録します。ゲートウェイが存在しないとデータ ソースは追加できないため、この順序になります。
手順 3 → Add the dataset owner to the data source.
選択肢: Add the dataset owner to the data source. / Configure an on-premises data gateway. / Configure a virtual network data gateway. / Add a data source. / Configure a scheduled refresh.
選択肢: Add the dataset owner to the data source. / Configure an on-premises data gateway. / Configure a virtual network data gateway. / Add a data source. / Configure a scheduled refresh.
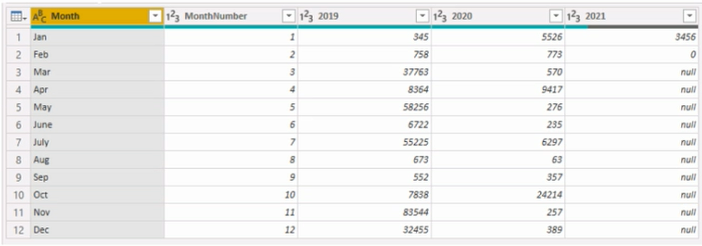
You receive annual sales data that must be included in Power BI reports.
From Power Query Editor, you connect to the Microsoft Excel source shown in the following exhibit.
You need to create a report that meets the following requirements:
• Visualizes the Sales value over a period of years and months • Adds a slicer for the month • Adds a slicer for the year
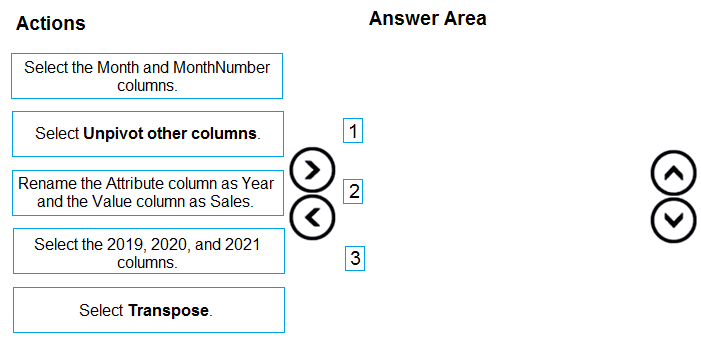
Which three actions should you perform in sequence? To answer, move the appropriate actions from the list of actions to the answer area and arrange them in the correct order.
解答: Select the Month and MonthNumber columns. / Select Unpivot other columns. / Rename the Attribute column as Year and the Value column as Sales.
選択肢: Select the Month and MonthNumber columns. / Select Unpivot other columns. / Rename the Attribute column as Year and the Value column as Sales. / Select the 2019, 2020, and 2021 columns. / Select Transpose.
選択肢: Select the Month and MonthNumber columns. / Select Unpivot other columns. / Rename the Attribute column as Year and the Value column as Sales. / Select the 2019, 2020, and 2021 columns. / Select Transpose.
手順 3 → Rename the Attribute column as Year and the Value column as Sales.
選択肢: Select the Month and MonthNumber columns. / Select Unpivot other columns. / Rename the Attribute column as Year and the Value column as Sales. / Select the 2019, 2020, and 2021 columns. / Select Transpose.
根拠: 「年および月の期間での Sales 値を視覚化する」
ピボット解除で生成された既定の列名 (Attribute / Value) を、要件どおり Year と Sales に変更して完成です。
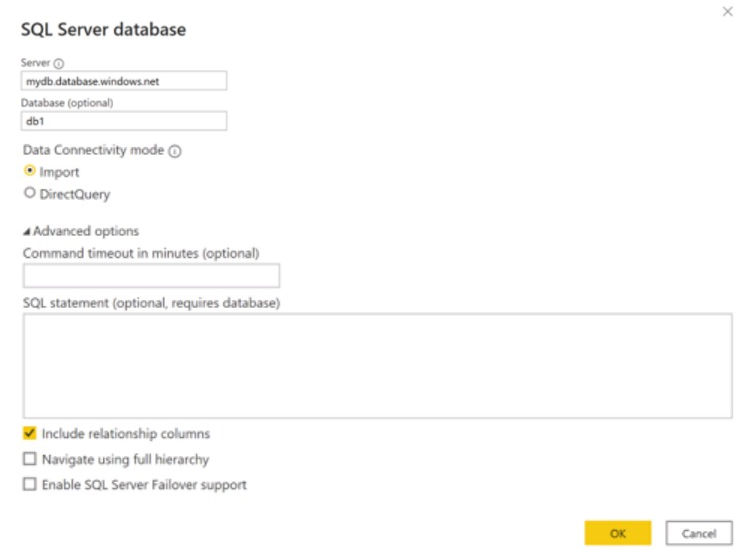
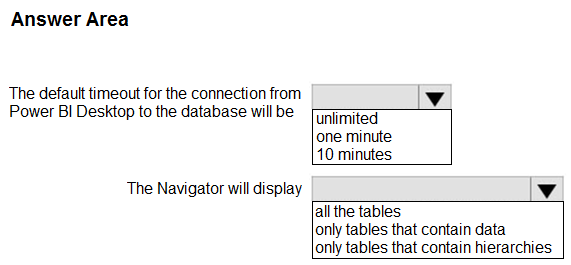
選択肢: all the tables / only tables that contain data / only tables that contain hierarchies
根拠: 「接続は、次の展示のように構成されています。」
展示では [完全な階層を使用してナビゲート (Navigate using full hierarchy)] がオフです。オフの場合、ナビゲーターは行と列にデータを含むテーブルのみをフラットに表示します。オンにすると、スキーマ階層を含む完全な階層 (空のテーブルを含む) が表示されます。
Question 21 (Topic 1 / #21) hotspot
ホットスポット -
次の表に示す Azure SQL データベースがあります。
次の要件を満たす単一の PBIX ファイルを構築することを計画しています。
• 開発ライフサイクルの各ステージに対応するデータベースからデータを使用する必要がある • Power BI デプロイ パイプラインは使用してはならない • ソリューションでは、管理作業を最小限に抑える必要がある
何をすべきでしょうか。回答するには、回答エリアで適切なオプションを選択してください。
注: 正しい選択はそれぞれ 1 ポイントの価値があります。
原文 (English) を表示
HOTSPOT -
You have the Azure SQL databases shown in the following table.
You plan to build a single PBIX file to meet the following requirements:
• Data must be consumed from the database that corresponds to each stage of the development lifecycle. • Power BI deployment pipelines must NOT be used. • The solution must minimize administrative effort.
What should you do? To answer, select the appropriate options in the answer area.
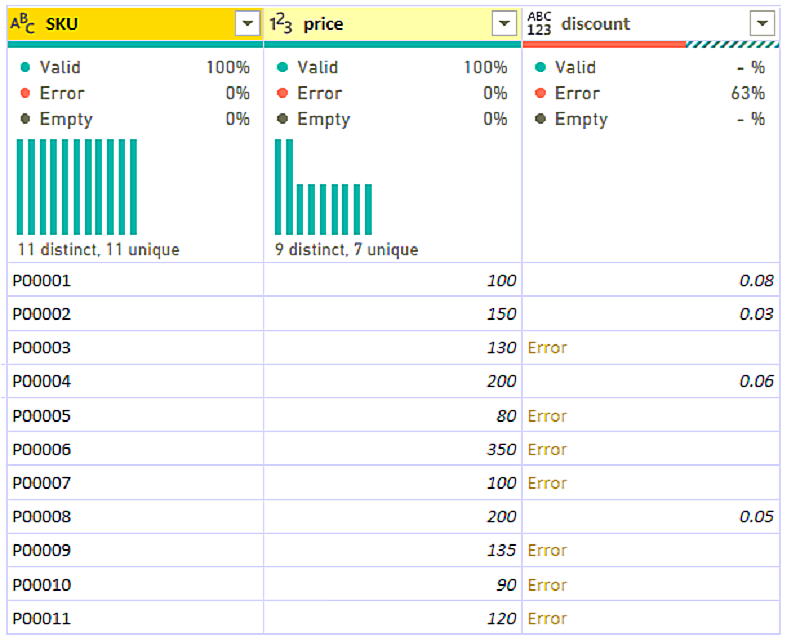
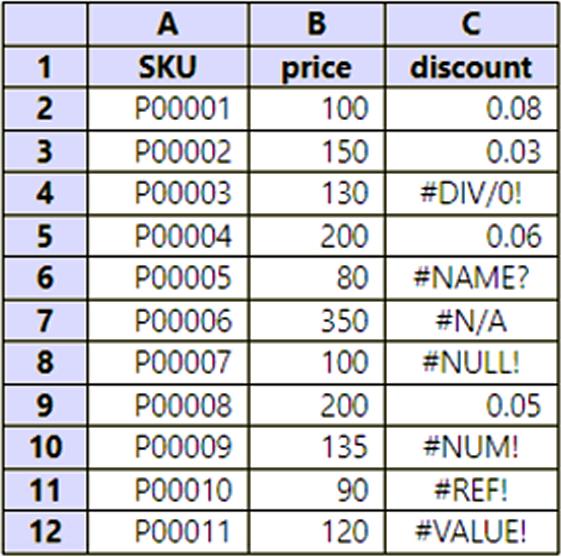
You use Power Query Editor to preview the data shown in the following exhibit.
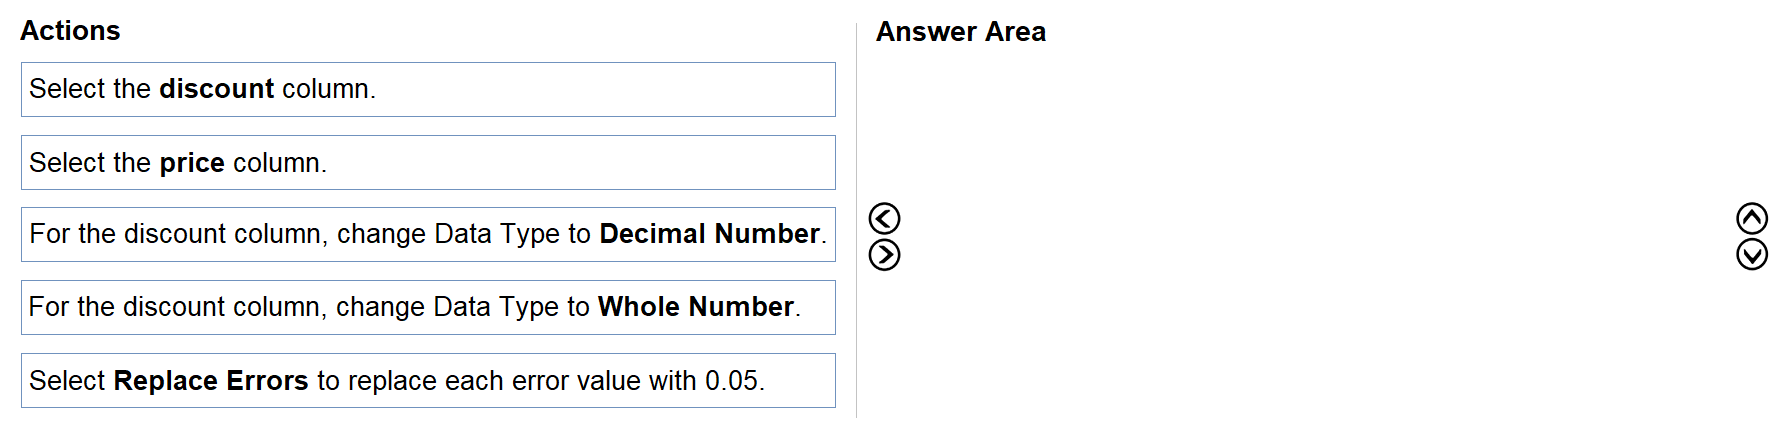
You need to clean and transform the query so that all the rows of data are maintained, and error values in the discount column are replaced with a discount of 0.05. The solution must minimize administrative effort.
Which three actions should you perform in sequence? To answer, move the appropriate actions from the list of actions to the answer area and arrange them in the correct order.
解答: Select the discount column. / Select Replace Errors to replace each error value with 0.05. / For the discount column, change Data Type to Decimal Number.
選択肢: Select the discount column. / Select the price column. / For the discount column, change Data Type to Decimal Number. / For the discount column, change Data Type to Whole Number. / Select Replace Errors to replace each error value with 0.05.
手順 2 → Select Replace Errors to replace each error value with 0.05.
選択肢: Select the discount column. / Select the price column. / For the discount column, change Data Type to Decimal Number. / For the discount column, change Data Type to Whole Number. / Select Replace Errors to replace each error value with 0.05.
手順 3 → For the discount column, change Data Type to Decimal Number.
選択肢: Select the discount column. / Select the price column. / For the discount column, change Data Type to Decimal Number. / For the discount column, change Data Type to Whole Number. / Select Replace Errors to replace each error value with 0.05.
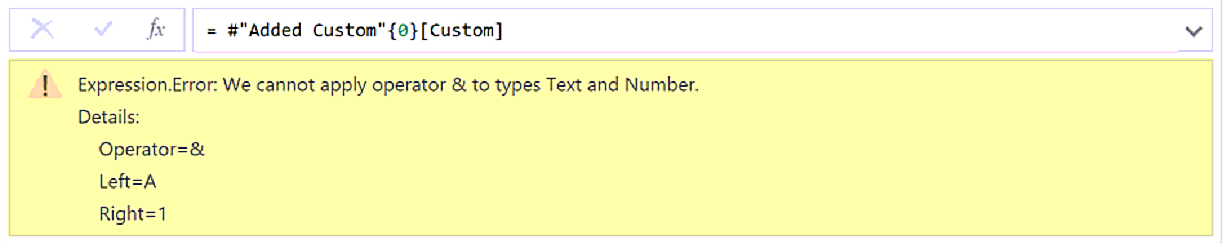
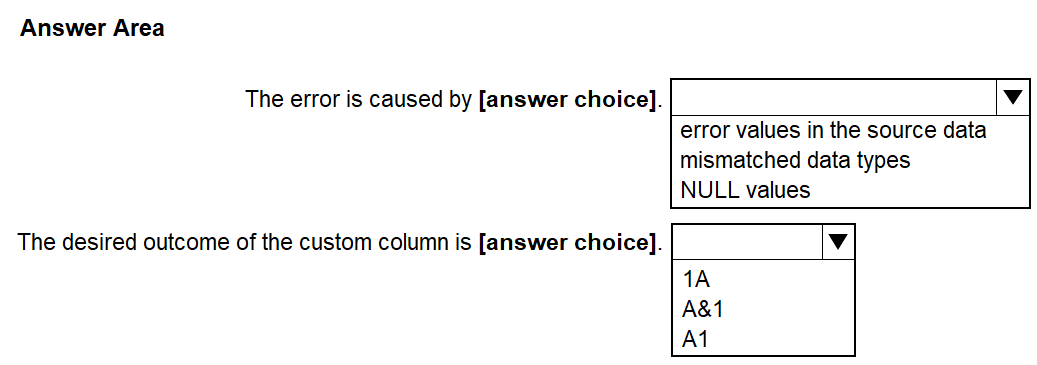
You attempt to use Power Query Editor to create a custom column and receive the error message shown in the following exhibit.
Use the drop-down menus to select the answer choice that completes each statement based on the information presented in the graphic.
NOTE: Each correct selection is worth one point.
解答: mismatched data types / A1
ポイント: M 言語の & はテキストの連結演算子で、テキストと数値のように型が混在すると 「We cannot apply operator & to types Text and Number」エラーになります。エラー メッセージの Left / Right の値から、意図した結果を逆算させる問題です。
エラーの原因 → mismatched data types
選択肢: error values in the source data / mismatched data types / NULL values
根拠: 「カスタム列を作成しようとしたところ、次の展示に示すエラー メッセージを受け取りました。」
エラー メッセージは「演算子 & を Text 型と Number 型に適用できない」(Left=A、Right=1) という内容です。これはデータ型の不一致そのものであり、ソース データのエラー値や NULL 値への言及はどこにもありません。
You have data in a Microsoft Excel worksheet as shown in the following table.
You need to use Power Query to clean and transform the dataset. The solution must meet the following requirements:
• If the discount column returns an error, a discount of 0.05 must be used. • All the rows of data must be maintained. • Administrative effort must be minimized.
ユーザーからの苦情を含む CSV ファイルがあります。ファイルには Logged という名前の列が含まれています。Logged には、各苦情が発生した日時が含まれています。Logged のデータは次の形式です: 2018-12-31 at 08:59。
ログに記録された日付で苦情を分析し、組み込みの日付階層を使用できるようにする必要があります。
何をすべきでしょうか。
A. [データ変換] オプションの解析機能を Logged 列に適用する。
B. Logged 列のデータ型を日付に変更する。
C. 区切り記号として at を使用して、Logged 列を分割する。
D. 2018-12-31 で始まる、例からの列を作成する。
原文 (English) を表示
You have a CSV file that contains user complaints. The file contains a column named Logged. Logged contains the date and time each complaint occurred. The data in Logged is in the following format: 2018-12-31 at 08:59.
You need to be able to analyze the complaints by the logged date and use a built-in date hierarchy.
What should you do?
A. Apply the Parse function from the Data transformations options to the Logged column.
B. Change the data type of the Logged column to Date.
C. Split the Logged column by using at as the delimiter.
D. Create a column by example that starts with 2018-12-31.
解答: C
ポイント: Q10 の類題 (誤答肢だけ差し替え) です。「2018-12-31 at 08:59」のような非標準形式の文字列から日付を取り出す最も確実な方法は、区切り記号 at での分割です。
You have two Microsoft Excel workbooks in a Microsoft OneDrive folder.
Each workbook contains a table named Sales. The tables have the same data structure in both workbooks.
You plan to use Power BI to combine both Sales tables into a single table and create visuals based on the data in the table. The solution must ensure that you can publish a separate report and dataset.
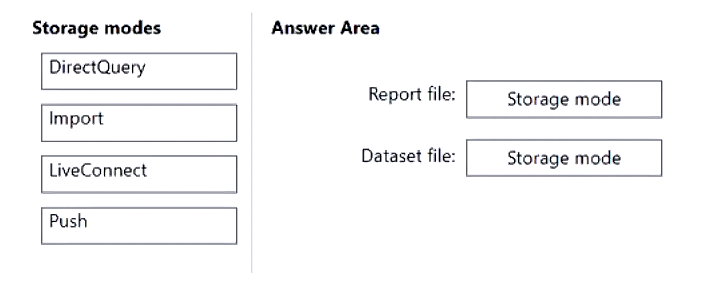
Which storage mode should you use for the report file and the dataset file? To answer, drag the appropriate modes to the correct files. Each mode may be used once, more than once, or not at all. You may need to drag the split bar between panes or scroll to view content.
Power Query を使用して、Order Header と Order Details という名前の 2 つのテーブルを Azure SQL データベースからインポートします。Order Header テーブルは、各テーブルにある Order ID という名前の列を使用して Order Details テーブルに関連付けられます。
各テーブルの固有の列を含む単一のクエリにテーブルを結合する必要があります。
Power Query エディターで何を選択すべきでしょうか。
A. クエリのマージ
B. ファイルの結合
C. クエリの追加
原文 (English) を表示
You use Power Query to import two tables named Order Header and Order Details from an Azure SQL database. The Order Header table relates to the Order Details table by using a column named Order ID in each table.
You need to combine the tables into a single query that contains the unique columns of each table.
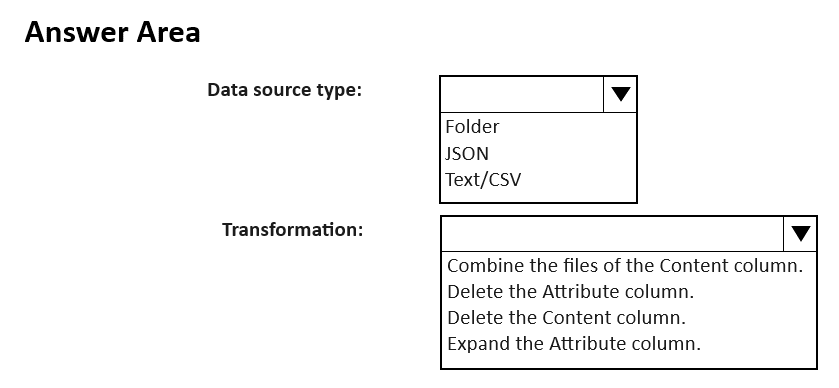
You need to use Power BI Desktop to make the metadata of the files available as a single dataset. The solution must NOT store the data of the JSON files.
Which type of data source should you use, and which transformation should you perform? To answer, select the appropriate options in the answer area.
This is a case study. Case studies are not timed separately. You can use as much exam time as you would like to complete each case. However, there may be additional case studies and sections on this exam. You must manage your time to ensure that you are able to complete all questions included on this exam in the time provided.
To answer the questions included in a case study, you will need to reference information that is provided in the case study. Case studies might contain exhibits and other resources that provide more information about the scenario that is described in the case study. Each question is independent of the other questions in this case study.
At the end of this case study, a review screen will appear. This screen allows you to review your answers and to make changes before you move to the next section of the exam. After you begin a new section, you cannot return to this section.
To start the case study - To display the first question in this case study, click the Next button. Use the buttons in the left pane to explore the content of the case study before you answer the questions. Clicking these buttons displays information such as business requirements, existing environment and problem statements. If the case study has an All Information tab, note that the information displayed is identical to the information displayed on the subsequent tabs. When you are ready to answer a question, click the Question button to return to the question.
General Overview -
Northwind Traders is a specialty food import company.
The company recently implemented Power BI to better understand its top customers, products, and suppliers.
Business Issues -
The sales department relies on the IT department to generate reports in Microsoft SQL Server Reporting Services (SSRS). The IT department takes too long to generate the reports and often misunderstands the report requirements.
Existing Environment. Data Sources
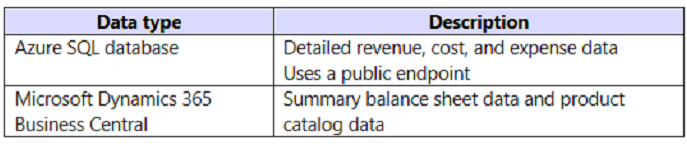
Northwind Traders uses the data sources shown in the following table.
Source2 is exported daily from a third-party system and stored in Microsoft SharePoint Online.
Existing Environment. Customer Worksheet
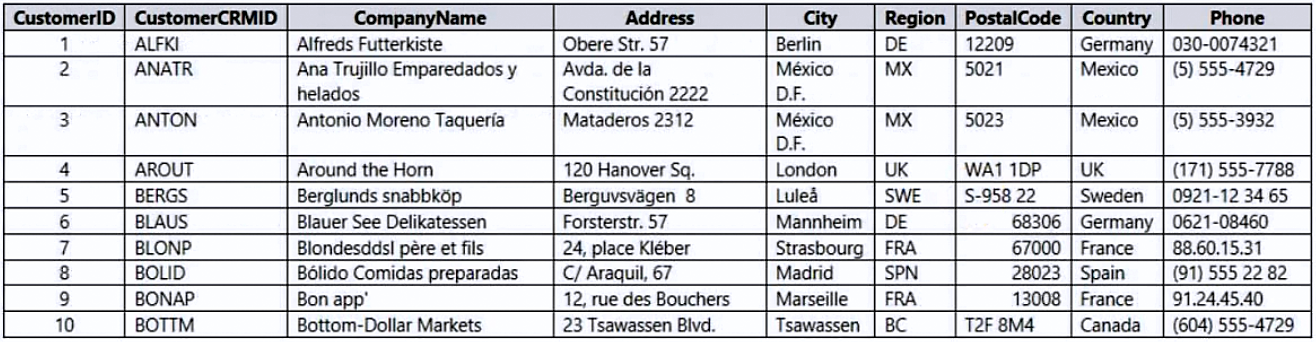
Source2 contains a single worksheet named Customer Details. The first 11 rows of the worksheet are shown in the following table.
All the fields in Source2 are mandatory.
The Address column in Customer Details is the billing address, which can differ from the shipping address.
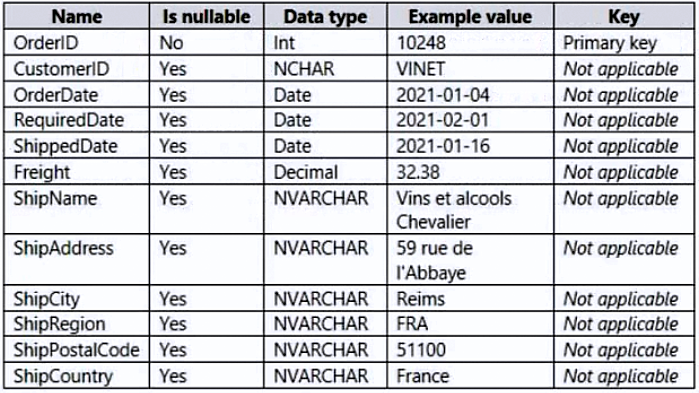
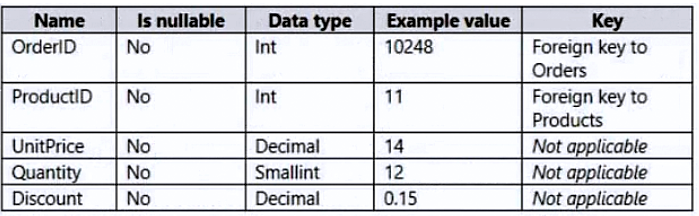
The Order Details table contains the following columns.
The address in the Orders table is the shipping address, which can differ from the billing address.
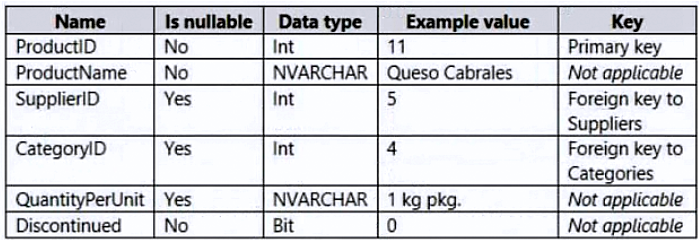
The Products table contains the following columns.
The Categories table contains the following columns.
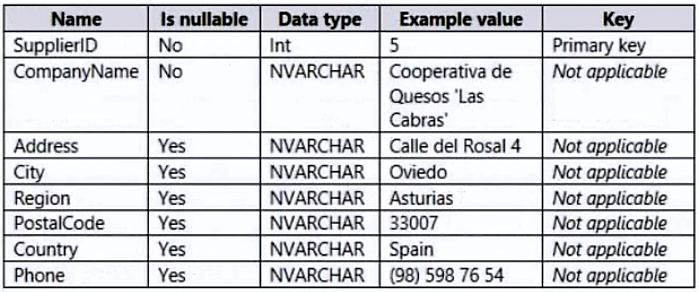
The Suppliers table contains the following columns.
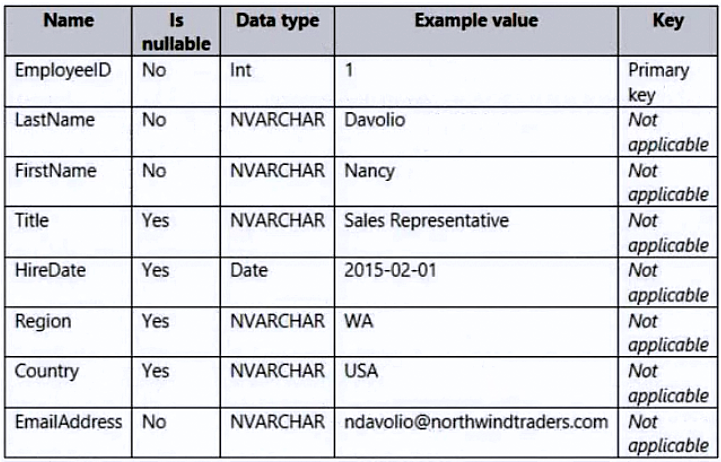
The Sales Employees table contains the following columns.
Each employee in the Sales Employees table is assigned to one sales region. Multiple employees can be assigned to each region.
Requirements. Report Requirements
Northwind Traders requires the following reports:
• Top Products • Top Customers • On-Time Shipping
The Top Customers report will show the top 20 customers based on the highest sales amounts in a selected order month or quarter, product category, and sales region.
The Top Products report will show the top 20 products based on the highest sales amounts sold in a selected order month or quarter, sales region, and product category. The report must also show which suppliers provide the top products.
The On-Time Shipping report will show the following metrics for a selected shipping month or quarter:
• The percentage of orders that were shipped late by country and shipping region • Customers that had multiple late shipments during the last quarter
Northwind Traders defines late orders as those shipped after the required shipping date.
The warehouse shipping department must be notified if the percentage of late orders within the current month exceeds 5%.
The reports must show historical data for the current calendar year and the last three calendar years.
Requirements. Technical Requirements
Northwind Traders identifies the following technical requirements:
• A single dataset must support all three reports. • The reports must be stored in a single Power BI workspace. • Report data must be current as of 7 AM Pacific Time each day. • The reports must provide fast response times when users interact with a visualization. • The data model must minimize the size of the dataset as much as possible, while meeting the report requirements and the technical requirements.
Requirements. Security Requirements
Access to the reports must be granted to Azure Active Directory (Azure AD) security groups only. An Azure AD security group exists for each department.
The sales department must be able to perform the following tasks in Power BI:
• Create, edit, and delete content in the reports. • Manage permissions for workspaces, datasets, and reports. • Publish, unpublish, update, and change the permissions for an app. • Assign Azure AD groups role-based access to the reports workspace.
Users in the sales department must be able to access only the data of the sales region to which they are assigned in the Sales Employees table.
Power BI has the following row-level security (RLS) Table filter DAX expression for the Sales Employees table.
[EmailAddress] = USERNAME()
RLS will be applied only to the sales department users. Users in all other departments must be able to view all the data.
You need to create the semantic model.
Which storage mode should you use for the tables in the semantic model?
Note: This question is part of a series of questions that present the same scenario. Each question in the series contains a unique solution that might meet the stated goals. Some question sets might have more than one correct solution, while others might not have a correct solution.
After you answer a question in this section, you will NOT be able to return to it. As a result, these questions will not appear in the review screen.
You have a data source that contains a column. The column contains case sensitive data.
You have a Power BI semantic model in DirectQuery mode.
You connect to the model and discover that it contains undefined values and errors.
You need to resolve the issue.
Solution: You implicitly convert the values into the required type.
Does this meet the goal?
A. Yes
B. No
解答: B
ポイント: 「大文字と小文字が区別されるデータ × DirectQuery」シリーズの 1 問です。Power BI のエンジンは文字列の大文字小文字を区別しない一方、ソース側は区別するため、大文字小文字のみが異なる値が衝突して未定義値やエラーが生じます。提示された解決策が「大文字小文字の問題」に効くかどうかだけで Yes/No を判定できます。
Note: This question is part of a series of questions that present the same scenario. Each question in the series contains a unique solution that might meet the stated goals. Some question sets might have more than one correct solution, while others might not have a correct solution.
After you answer a question in this section, you will NOT be able to return to it. As a result, these questions will not appear in the review screen.
You have a data source that contains a column. The column contains case sensitive data.
You have a Power BI semantic model in DirectQuery mode.
You connect to the model and discover that it contains undefined values and errors.
You need to resolve the issue.
Solution: You change the semantic model mode.
Does this meet the goal?
A. Yes
B. No
解答: B
ポイント: 「大文字と小文字が区別されるデータ × DirectQuery」シリーズの 1 問です。モードを変えても Power BI エンジンが大文字小文字を区別しないという性質は変わらない、が判断軸です。
A. × 不正解
根拠: 「解決策: セマンティック モデルのモードを変更します。」
根拠: 「この列には大文字と小文字が区別されるデータが含まれています。」
DirectQuery からインポートなどにモードを変更しても、Power BI のエンジン自体が文字列の大文字小文字を区別しない事実は変わりません。大文字小文字のみが異なる値の衝突 (未定義値とエラーの原因) はモードに関係なく発生するため、解決策になりません。
解決策: ソース クエリまたは Power Query エディターで、大文字と小文字の表記を正規化します。
これは目標を達成していますか?
A. はい
B. いいえ
原文 (English) を表示
Note: This question is part of a series of questions that present the same scenario. Each question in the series contains a unique solution that might meet the stated goals. Some question sets might have more than one correct solution, while others might not have a correct solution.
After you answer a question in this section, you will NOT be able to return to it. As a result, these questions will not appear in the review screen.
You have a data source that contains a column. The column contains case sensitive data.
You have a Power BI semantic model in DirectQuery mode.
You connect to the model and discover that it contains undefined values and errors.
You need to resolve the issue.
Solution: You normalize casing in the source query or Power Query Editor.
Does this meet the goal?
A. Yes
B. No
解答: A
ポイント: 同シリーズの Yes 枠です。取得段階 (ソース クエリまたは Power Query) で表記を正規化すれば、大文字小文字のみが異なる値の衝突そのものが消滅します。
A. ○ 正解
根拠: 「解決策: ソース クエリまたは Power Query エディターで、大文字と小文字の表記を正規化します。」
根拠: 「この列には大文字と小文字が区別されるデータが含まれています。」
エラーの原因は、ソースでは別の値である「大文字小文字のみが異なる値」が Power BI 側で同一視されて衝突することです。取得時に Text.Upper や Text.Lower などで表記を統一すれば衝突自体がなくなり、未定義値とエラーは解消します (これらの変換はソース側の SQL に折りたたまれるため DirectQuery でも有効です)。
Note: This question is part of a series of questions that present the same scenario. Each question in the series contains a unique solution that might meet the stated goals. Some question sets might have more than one correct solution, while others might not have a correct solution.
After you answer a question in this section, you will NOT be able to return to it. As a result, these questions will not appear in the review screen.
You have a data source that contains a column. The column contains case sensitive data.
You have a Power BI semantic model in DirectQuery mode.
You connect to the model and discover that it contains undefined values and errors.
You need to resolve the issue.
Solution: You add an index key and normalize casing in the data source.
エラーの原因は、ソースでは別の値である「大文字小文字のみが異なる値」が、大文字小文字を区別しない Power BI 側では同一値と見なされて衝突することです。表記を正規化すればこの衝突自体が消滅し、正規化によって失われかねない一意性はインデックス キーの追加が補います。原因に直接作用するため目標を達成します。
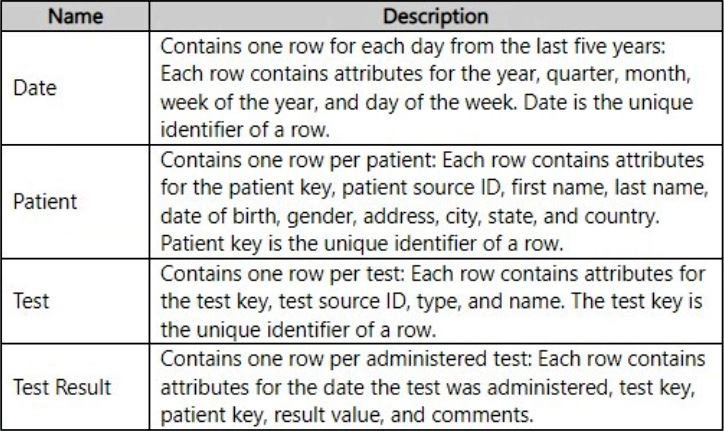
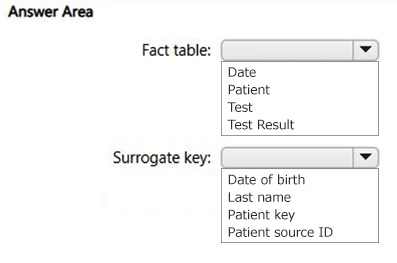
You are designing the data model for a Power BI semantic model.
You have the following tables in the star schema.
Which table is the fact table of the star schema, and which column in the Patient table is the surrogate key of the star schema? To answer, select the appropriate options in the answer area.
You discover that the semantic model contains values that display as errors.
You need to use data profiling features in Power Query to preview the data and identify the issues.
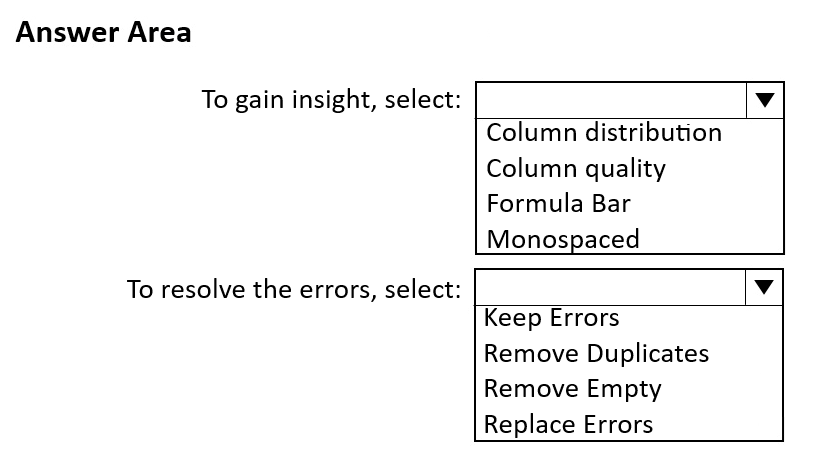
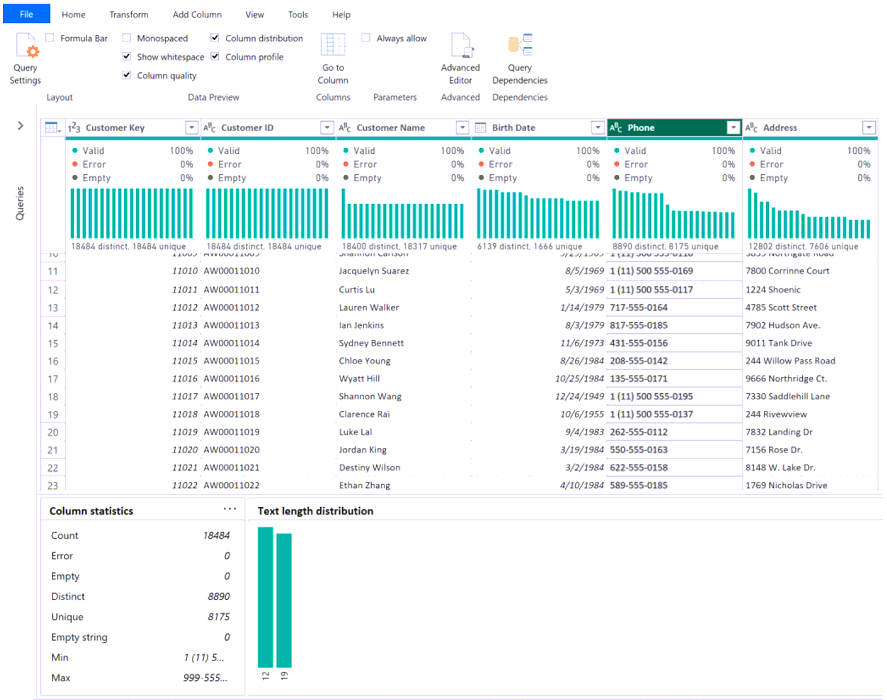
What should you select to gain insight into the number of errors in the model, and what should you select to resolve the errors? To answer, select the appropriate options in the answer area.
Power Query エディターでどの 3 つのオブジェクトを作成すべきでしょうか。それぞれの正解はソリューションの一部を提示します。
注: 正しい選択はそれぞれ 1 ポイントの価値があります。
A. CustomerID に対するフィルターを持つ Orders クエリ
B. CustomerID に対するフィルターを持つ Customers クエリ
C. 顧客の一覧を含む単一の列を持つ Orders クエリ
D. 顧客 ID の一覧を含む単一の列を持つ Customers クエリ
E. 候補値の設定にクエリを使用する CustomerID 用のパラメーター
F. 候補値の設定に手動で入力した値を使用する CustomerID 用のパラメーター
原文 (English) を表示
You need to create a semantic model in Power BI Desktop. The solution must meet the following requirements:
• The model must contain a table named Orders that has one row per order. Each row will contain the total amount per order. • The orders must be filtered to the selected CustomerID value. • Users must select the CustomerID value from a list. • The list of customers must come from an OData source.
Which three objects should you create in Power Query Editor? Each correct answer presents part of the solution.
NOTE: Each correct selection is worth one point.
A. an Orders query that has a filter on CustomerID
B. a Customers query that has a filter on CustomerID
C. an Orders query that has a single column containing a list of customers
D. a Customers query that has a single column containing a list of customer IDs
E. a parameter for CustomerID that uses a query to populate the suggested values
F. a parameter for CustomerID that uses manually entered values to populate the suggested values
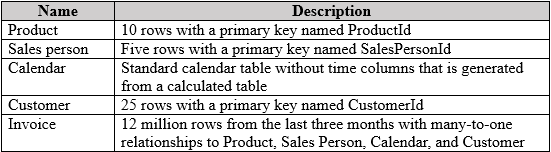
過去 3 日間、Power BI での更新が失敗しており、「ご利用のレベル (tier) で割り当て可能な最大メモリに達しました。より多くのメモリを利用できるレベルへのアップグレードをご検討ください。」というエラー メッセージが表示されています。
エラーを解決し、エンド ユーザーのクエリ応答時間を最小限に抑える必要があります。
何をすべきでしょうか。
A. SalesPersonId 列に基づいて、Sales person テーブルと invoice テーブルをマージする。
B. invoice テーブルを DirectQuery テーブルに変更してソースからデータをライブで読み取り、ディメンション テーブルのみをインポート テーブルとして保持する。
C. Product、Sales person、Calendar、Customer 別に売上を集計して、invoice テーブルのサイズを縮小する。
D. invoice テーブルを、履歴データを DirectQuery テーブル、ホット データをインポート テーブルとして含む複合テーブルに変更し、テーブルをパーティション分割する。
原文 (English) を表示
You have a Power BI report named Report that contains the following tables.
For the last three days, refresh in Power BI has failed, and you receive the following error message: “You have reached the maximum allowable memory allocation for your tier. Consider upgrading to a tier with more available memory.”
You need to resolve the error and ensure that query response times are minimized for end users.
What should you do?
A. Merge the Sales person and invoice tables based on the SalesPersonId column.
B. Change the invoice table to a DirectQuery table and read the data live from the source, retaining only the dimension tables as import tables.
C. Reduce the size of the invoice table by summarizing sales by Product, Sales person, Calendar, and Customer.
D. Change the invoice table to a composite table that contains historical data as a DirectQuery table and hot data as an import table, and then partition the table.
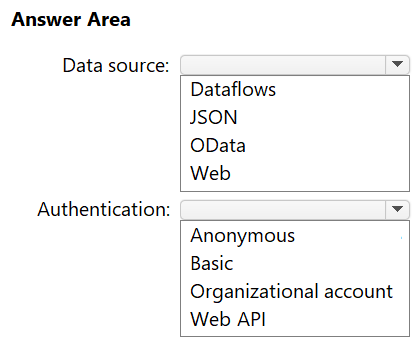
API への接続には、どのデータ ソースと認証方法を使用すべきでしょうか。回答するには、回答エリアで適切なオプションを選択してください。
注: 正しい選択はそれぞれ 1 ポイントの価値があります。
原文 (English) を表示
HOTSPOT -
You plan to use Power Query Editor to get data from an API.
The API returns a JSON response.
You have a username and password for the API.
Which data source and authentication method should you use to connect to the API? To answer, select the appropriate options in the answer area.
NOTE: Each correct selection is worth one point.
解答: Web / Basic
ポイント: 「URL で公開される API への接続 = Web コネクタ」「ユーザー名 + パスワード = 基本 (Basic) 認証」という対応付けの問題です。応答形式が JSON でも、コネクタは JSON ではなく Web を選ぶのがポイントです。
データ ソース → Web
選択肢: Dataflows / JSON / OData / Web
根拠: 「Power Query エディターを使用して API からデータを取得することを計画しています。」
根拠: 「API は JSON 応答を返します。」
URL で呼び出す API には Web コネクタで接続します。返ってきた JSON は Power Query が自動的に解析して展開できます。JSON コネクタは .json ファイルを読み込むためのもの、OData は OData プロトコルのサービス専用、Dataflows は Power BI データフローに接続するためのものです。
認証 → Basic
選択肢: Anonymous / Basic / Organizational account / Web API
根拠: 「API のユーザー名とパスワードを持っています。」
ユーザー名とパスワードの組み合わせで認証する方式が基本 (Basic) 認証です。Anonymous は資格情報なし、Organizational account は Microsoft Entra ID (Azure AD) アカウントでのサインイン、Web API は API キーを使う方式で、いずれも本問の資格情報と一致しません。
You plan to create a Power BI semantic model named Model1 that will contain data from an Azure SQL database.
Model1 will have the following tables.
You create DimDate and DimProduct by using import storage mode.
You need to configure the storage mode for each remaining table. The solution must meet the following requirements:
• The data in FactSales must be available within five minutes of being available in the source data. • The query response time for reports connected to the model must be minimized.
Which storage mode should you configure for each table? To answer, select the appropriate options in the answer area.
Microsoft SQL Server データベースと Oracle データベースからデータをインポートする Power BI セマンティック モデルがあります。セマンティック モデルは Power BI サービスにデプロイされています。SQL Server データ ソースには、既にパラメーターが使用されています。
A. Power BI Desktop から、パラメーターを使用するように Oracle データ ソースを変更し、モデルを Power BI サービスに再発行する。
B. Power BI サービスから、SQL Server データ ソースのパラメーターを変更する。
C. Power BI サービスから、既存のモデルをデータ ソースとして使用する新しいセマンティック モデルを作成し、新しいモデルをパラメーター化する。
D. Power BI サービスから、モデルのパラメーター値を設定する。
原文 (English) を表示
You have a Power BI semantic model that imports data from a Microsoft SQL Server database and an Oracle database. The semantic model is deployed to the Power BI service. Parameters are already used for the SQL Server data source.
You are planning to make change to the semantic model that will ensure consistent behavior across all the data sources.
You need to enable parameterization for the Oracle data source. The solution must minimize changes to the existing model.
What should you do?
A. From Power BI Desktop, modify the Oracle data source to use a parameter, and then republish the model to the Power BI service.
B. From the Power BI service, modify the parameters of the SQL Server data source.
C. From the Power BI service, create a new semantic model that uses the existing model as a data source, and then parameterize the new model.
D. From the Power BI service, set a parameter value for the model.
解答: A
ポイント: パラメーターの「定義・適用」は Power Query (Power BI Desktop) でしか行えず、Power BI サービス側でできるのは定義済みパラメーターの「値の変更」だけ、という役割分担を問う問題です。
A. ○ 正解
根拠: 「Oracle データ ソースのパラメーター化を有効にする必要があります。」
Power BI Desktop の Power Query エディターでパラメーターを作成して Oracle 接続 (サーバー名など) に適用し、モデルを再発行します。既存モデルの該当箇所だけを直す最小限の変更で、SQL Server 側と同じパラメーター方式に揃えられます。
B. × 不正解
根拠: 「SQL Server データ ソースには、既にパラメーターが使用されています。」
サービス上で変更できるのは既存の SQL Server 用パラメーターの「値」だけです。それを変更しても Oracle データ ソースは何もパラメーター化されません。
Power BI Desktop でレポートを作成しています。 col1 という名前のフリー テキスト フィールドを含むデータ抽出を読み込みます。 col1 の文字列長の度数分布を分析する必要があります。ソリューションでは、モデルのサイズに影響を与えてはなりません。 何をすべきでしょうか。
A. レポートで、col1 の長さを計算する DAX 計算列を追加する
B. レポートで、col1 の平均の長さを計算する DAX 関数を追加する
C. Power Query エディターで、col1 の長さを計算する列を追加する
D. Power Query エディターで、col1 の列プロファイルの分布を、テキストの長さでグループ化するように変更する
原文 (English) を表示
You are creating a report in Power BI Desktop. You load a data extract that includes a free text field named coll. You need to analyze the frequency distribution of the string lengths in col1. The solution must not affect the size of the model. What should you do?
A. In the report, add a DAX calculated column that calculates the length of col1
B. In the report, add a DAX function that calculates the average length of col1
C. From Power Query Editor, add a column that calculates the length of col1
D. From Power Query Editor, change the distribution for the Column profile to group by length for col1
B. 新しいワークスペースを作成し、データセットとレポートをコピーして、人事マネージャーをワークスペースのメンバーとして追加する。
C. データセットをホストしているワークスペースとは別のワークスペースにレポートを発行する。
D. レポートとデータセットをホストしている既存のワークスペースのメンバーとして人事マネージャーを追加する。
原文 (English) を表示
You have a collection of reports for the HR department of your company. The datasets use row-level security (RLS). The company has multiple sales regions. Each sales region has an HR manager. You need to ensure that the HR managers can interact with the data from their region only. The HR managers must be prevented from changing the layout of the reports. How should you provision access to the reports for the HR managers?
A. Publish the reports in an app and grant the HR managers access permission.
B. Create a new workspace, copy the datasets and reports, and add the HR managers as members of the workspace.
C. Publish the reports to a different workspace other than the one hosting the datasets.
D. Add the HR managers as members of the existing workspace that hosts the reports and the datasets.
You need to provide a user with the ability to add members to a workspace. The solution must use the principle of least privilege. Which role should you assign to the user?
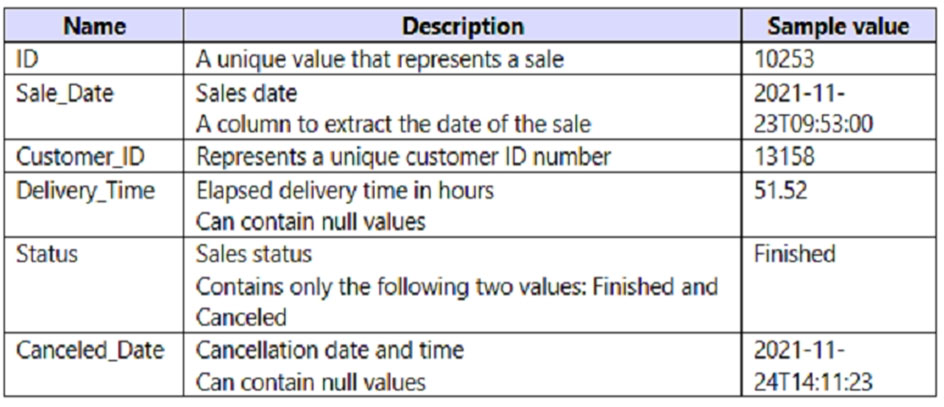
次の表に示す列をインポートする、Sales という名前の Power BI クエリがあります。 ユーザーは Sales_Date フィールドの日付部分のみを使用します。分析には Status が Finished の行のみが使用されます。 分析に影響を与えずに、クエリの読み込み時間を短縮する必要があります。 この目標を達成する 2 つの操作はどれですか。それぞれの正解は完全なソリューションを提示します。 注: 正しい選択はそれぞれ 1 ポイントの価値があります。
A. Sales[Status] の値が Canceled の行を削除する。
B. Sales[Sales_Date] を削除する。
C. Sale[Delivery_Time] のデータ型を整数に変更する。
D. Sales[Sale_Date] を別々の日付列と時刻列に分割する。
E. Sales[Canceled Date] を削除する。
原文 (English) を表示
You have a Power BI query named Sales that imports the columns shown in the following table. Users only use the date part of the Sales_Date field. Only rows with a Status of Finished are used in analysis. You need to reduce the load times of the query without affecting the analysis. Which two actions achieve this goal? Each correct answer presents a complete solution. NOTE: Each correct selection is worth one point.
A. Remove the rows in which Sales[Status] has a value of Canceled.
B. Remove Sales[Sales_Date].
C. Change the data type of Sale[Delivery_Time] to Integer.
D. Split Sales[Sale_Date] into separate date and time columns.
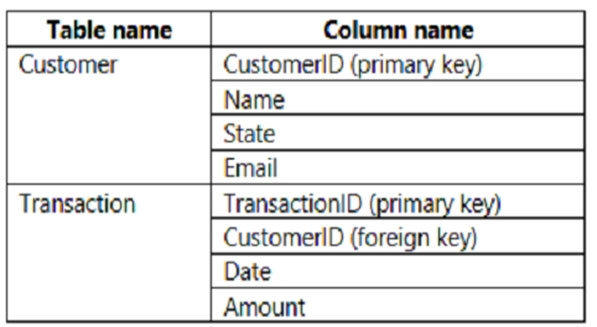
You build a report to analyze customer transactions from a database that contains the tables shown in the following table. You import the tables. Which relationship should you use to link the tables?
C. レポートの受信者が自分の送信したメールに基づく結果のみを表示できるように、行レベル セキュリティ (RLS) を実装する。
原文 (English) を表示
You have a custom connector that returns ID, From, To, Subject, Body, and Has Attachments for every email sent during the past year. More than 10 million records are returned. You build a report analyzing the internal networks of employees based on whom they send emails to. You need to prevent report recipients from reading the analyzed emails. The solution must minimize the model size. What should you do?
A. From Model view, set the Subject and Body columns to Hidden.
B. Remove the Subject and Body columns during the import.
C. Implement row-level security (RLS) so that the report recipients can only see results based on the emails they sent.
RLS は行を絞り込むだけで、Subject 列と Body 列はモデルに残ります。受信者は自分に見える行のメール本文を読めてしまい、モデル サイズも減りません。
Question 65 (Topic 2 / #7) hotspot
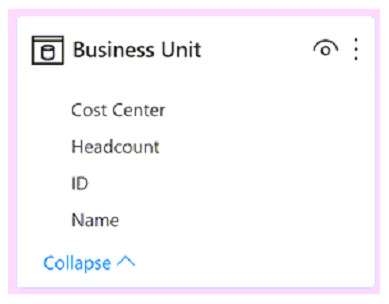
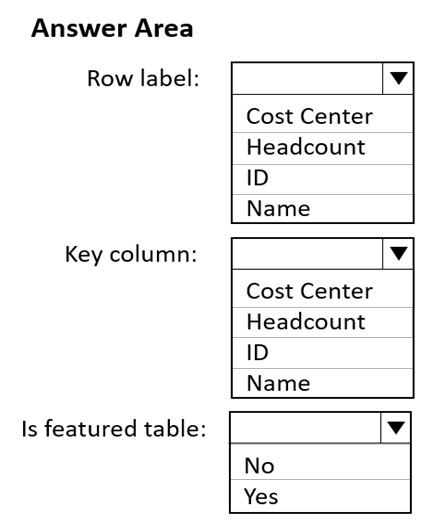
ホットスポット - 次の展示に示すテーブルを含む Power BI データセットを作成します。 テーブルを Microsoft Excel の組織データ型として利用できるようにする必要があります。 テーブルのプロパティをどのように構成すべきでしょうか。回答するには、回答エリアで適切なオプションを選択してください。 注: 正しい選択はそれぞれ 1 ポイントの価値があります。 ホット エリア:
原文 (English) を表示
HOTSPOT - You create a Power BI dataset that contains the table shown in the following exhibit. You need to make the table available as an organizational data type in Microsoft Excel. How should you configure the properties of the table? To answer, select the appropriate options in the answer area. NOTE: Each correct selection is worth one point. Hot Area:
解答: Name / ID / Yes
ポイント: Excel の組織データ型 = Power BI の「おすすめテーブル (featured table)」機能です。設定は 3 点セット: [おすすめテーブルにする] = はい、[行ラベル] = 人が読める表示名の列、[キー列] = 行を一意に識別する列。
Row label (行ラベル) → Name
選択肢: Cost Center / Headcount / ID / Name
根拠: 「テーブルを Microsoft Excel の組織データ型として利用できるようにする必要があります。」
行ラベルは、Excel のセルやカードに表示される「人が読んでわかる」代表値の列です。Business Unit テーブル (画像) では、事業部門を表す表示名の Name が適切です。
Key column (キー列) → ID
選択肢: Cost Center / Headcount / ID / Name
根拠: 「テーブルを Microsoft Excel の組織データ型として利用できるようにする必要があります。」
キー列には各行を一意に識別する列を指定します。Excel はこのキーで行を照合してデータ型としてリンクします。表示名の Name は重複の可能性があるため、一意識別子の ID を使います。
Is featured table (おすすめテーブル) → Yes
選択肢: No / Yes
根拠: 「テーブルを Microsoft Excel の組織データ型として利用できるようにする必要があります。」
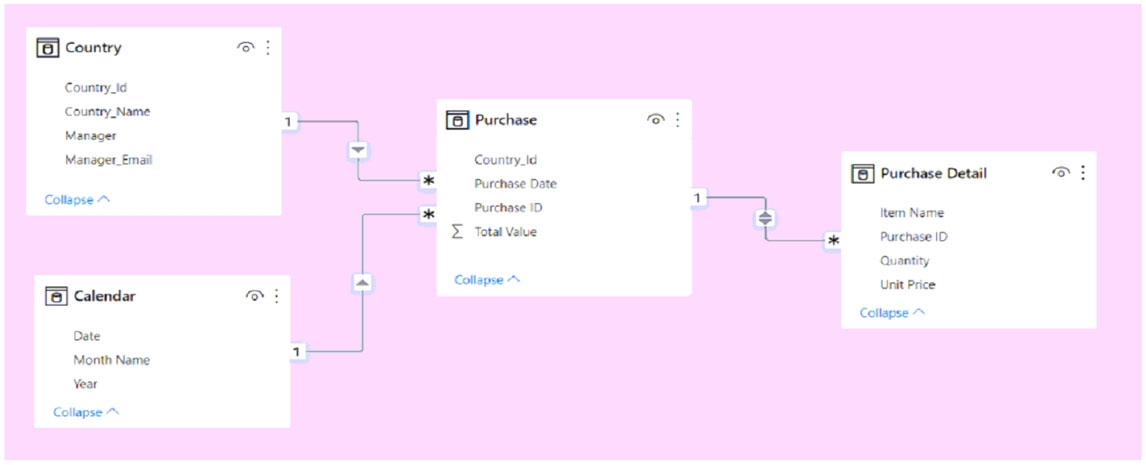
A. USERNAME DAX 関数を使用して Country[Manager_Email] をフィルター処理する単一のロールを作成する。
B. USEROBJECTID DAX 関数を使用して Country[Manager_Email] をフィルター処理する単一のロールを作成する。
C. Purchase Detail と Purchase の間のリレーションシップで、[双方向にセキュリティ フィルターを適用する] を選択する。
D. 国ごとに 1 つのロールを作成する。
E. Purchase と Purchase Detail の間のリレーションシップで、クロス フィルターの方向を単一に変更する。
原文 (English) を表示
You have the Power BI model shown in the following exhibit. A manager can represent only a single country. You need to use row-level security (RLS) to meet the following requirements: ✑ The managers must only see the data of their respective country. ✑ The number of RLS roles must be minimized. Which two actions should you perform? Each correct answer presents a complete solution. NOTE: Each correct selection is worth one point.
A. Create a single role that filters Country[Manager_Email] by using the USERNAME DAX function.
B. Create a single role that filters Country[Manager_Email] by using the USEROBJECTID DAX function.
C. For the relationship between Purchase Detail and Purchase, select Apply security filter in both directions.
D. Create one role for each country.
E. For the relationship between Purchase and Purchase Detail, change the Cross filter direction to Single.
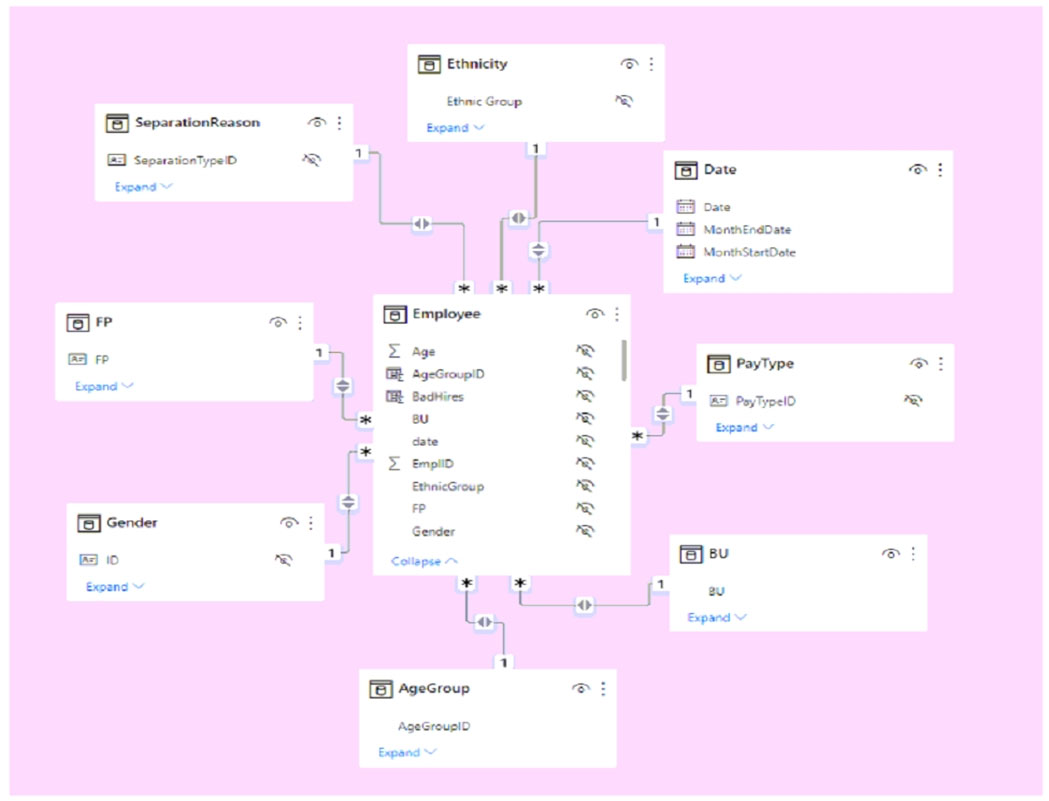
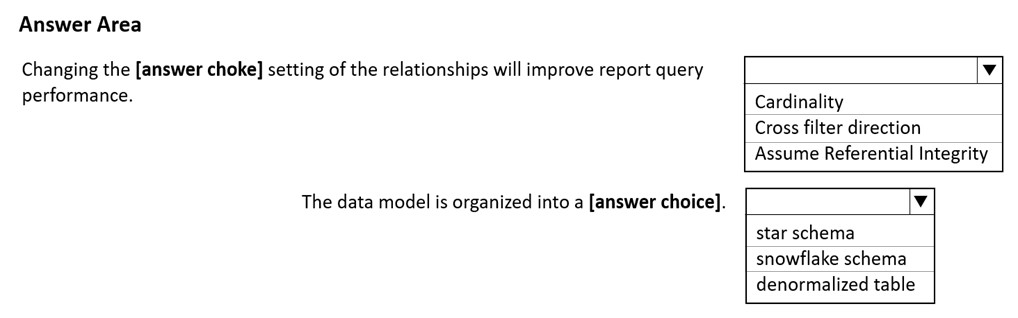
HOTSPOT - You have a Power BI imported dataset that contains the data model shown in the following exhibit. Use the drop-down menus to select the answer choice that completes each statement based on the information presented in the graphic. NOTE: Each correct selection is worth one point. Hot Area:
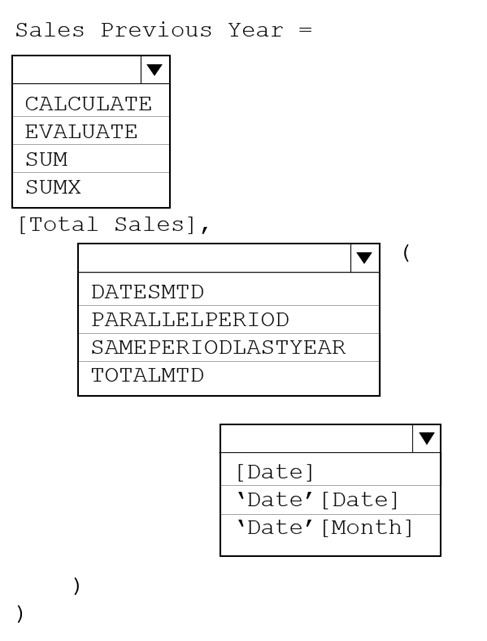
ホットスポット - Sales という名前のテーブルと、関連付けられた日付テーブルを含む Power BI モデルがあります。Sales には Total Sales という名前のメジャーが含まれています。 前年の同じ月の売上合計を計算するメジャーを作成する必要があります。 計算をどのように完成させるべきでしょうか。回答するには、回答エリアで適切なオプションを選択してください。 注: 正しい選択はそれぞれ 1 ポイントの価値があります。 ホット エリア:
原文 (English) を表示
HOTSPOT - You have a Power BI model that contains a table named Sales and a related date table. Sales contains a measure named Total Sales. You need to create a measure that calculates the total sales from the equivalent month of the previous year. How should you complete the calculation? To answer, select the appropriate options in the answer area. NOTE: Each correct selection is worth one point. Hot Area:
DRAG DROP - You plan to create a report that will display sales data from the last year for multiple regions. You need to restrict access to individual rows of the data on a per region-basis by using roles. Which four actions should you perform in sequence? To answer, move the appropriate actions from the list of actions to the answer area and arrange them in the correct order. Select and Place:
解答: Import the data to Power BI Desktop. / Create a role definition. / Publish the report. / Assign users to the role.
ポイント: 行レベル セキュリティ (RLS) 導入の標準手順です。Desktop 側で「データ取り込み → ロール定義」、発行後にサービス側で「ロールへのメンバー割り当て」という役割分担を覚えます。「Add a filter to the report」はただのレポート フィルターでセキュリティにはならない、が引っかけです。
手順 1 → Import the data to Power BI Desktop.
選択肢: Publish the report. / Assign users to the role. / Add a filter to the report. / Create a role definition. / Import the data to Power BI Desktop.
まず Power BI Desktop にデータをインポートします。ロールの定義もレポートの作成も、モデルにデータが取り込まれていることが前提です。
手順 2 → Create a role definition.
選択肢: Publish the report. / Assign users to the role. / Add a filter to the report. / Create a role definition. / Import the data to Power BI Desktop.
根拠: 「ロールを使用して、地域ごとにデータの個々の行へのアクセスを制限する必要があります。」
Power BI Desktop の [ロールの管理] で、地域ごとに行をフィルターする DAX 式を持つロールを定義します。レポートにフィルターを追加する操作 (Add a filter to the report) は表示上の絞り込みにすぎず、ユーザーが解除できるためセキュリティにはなりません。
手順 3 → Publish the report.
選択肢: Publish the report. / Assign users to the role. / Add a filter to the report. / Create a role definition. / Import the data to Power BI Desktop.
ロールを定義したレポートを Power BI サービスに発行します。メンバーの割り当てはサービス側の機能なので、発行が先です。
手順 4 → Assign users to the role.
選択肢: Publish the report. / Assign users to the role. / Add a filter to the report. / Create a role definition. / Import the data to Power BI Desktop.
最後に Power BI サービスのセマンティック モデルの [セキュリティ] 設定で、各地域のロールにユーザー (またはグループ) を割り当てます。これで各ユーザーには自分の地域の行だけが表示されます。
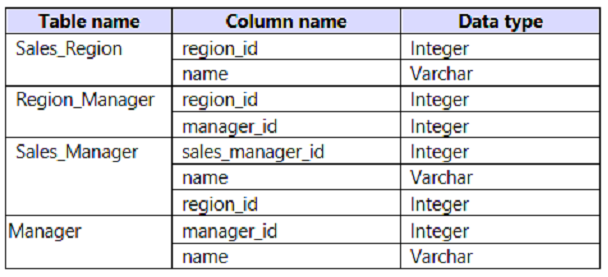
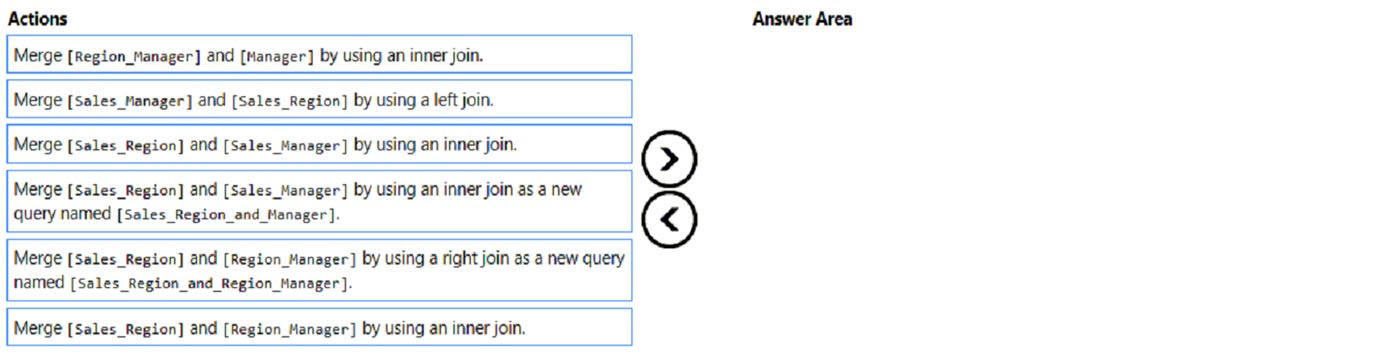
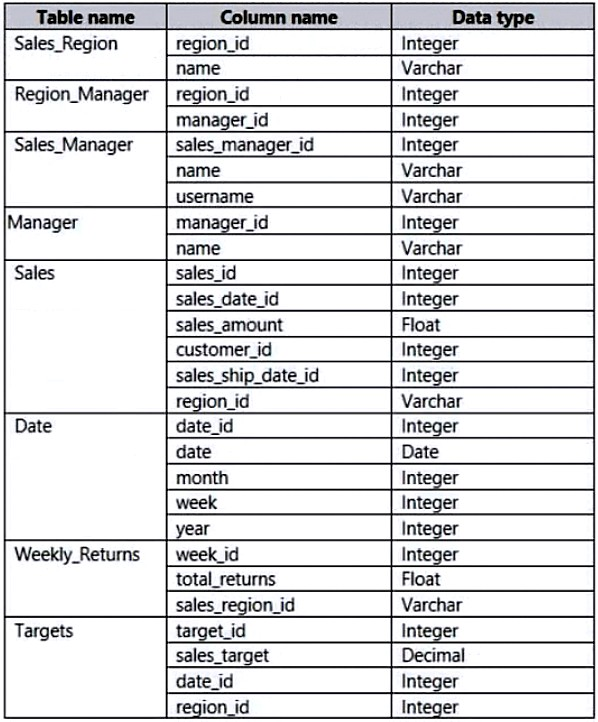
DRAG DROP - You create a data model in Power BI. Report developers and users provide feedback that the data model is too complex. The model contains the following tables. The model has the following relationships: ✑ There is a one-to-one relationship between Sales_Region and Region_Manager. ✑ There are more records in Manager than in Region_Manager, but every record in Region_Manager has a corresponding record in Manager. ✑ There are more records in Sales_Manager than in Sales_Region, but every record in Sales_Region has a corresponding record in Sales_Manager. You need to denormalize the model into a single table. Only managers who are associated to a sales region must be included in the reports. Which three actions should you perform in sequence? To answer, move the appropriate actions from the list of actions to the answer area and arrange them in the correct order. NOTE: More than one order of answer choices is correct. You will receive credit for any of the correct orders you select. Select and Place:
解答: Merge [Region_Manager] and [Manager] by using an inner join. / Merge [Sales_Region] and [Sales_Manager] by using an inner join. / Merge [Sales_Region] and [Region_Manager] by using an inner join.
手順 1 (順不同) → Merge [Region_Manager] and [Manager] by using an inner join.
選択肢: Merge [Region_Manager] and [Manager] by using an inner join. / Merge [Sales_Manager] and [Sales_Region] by using a left join. / Merge [Sales_Region] and [Sales_Manager] by using an inner join. / Merge [Sales_Region] and [Sales_Manager] by using an inner join as a new query named [Sales_Region_and_Manager]. / Merge [Sales_Region] and [Region_Manager] by using a right join as a new query named [Sales_Region_and_Region_Manager]. / Merge [Sales_Region] and [Region_Manager] by using an inner join.
手順 2 (順不同) → Merge [Sales_Region] and [Sales_Manager] by using an inner join.
選択肢: Merge [Region_Manager] and [Manager] by using an inner join. / Merge [Sales_Manager] and [Sales_Region] by using a left join. / Merge [Sales_Region] and [Sales_Manager] by using an inner join. / Merge [Sales_Region] and [Sales_Manager] by using an inner join as a new query named [Sales_Region_and_Manager]. / Merge [Sales_Region] and [Region_Manager] by using a right join as a new query named [Sales_Region_and_Region_Manager]. / Merge [Sales_Region] and [Region_Manager] by using an inner join.
Sales_Region に営業マネージャー情報を内部結合で付加します。Sales_Region の全レコードには対応する Sales_Manager があるため地域の行は保持され、地域を持たない余分な営業マネージャーは除外されます。左結合 (Merge [Sales_Manager] and [Sales_Region] ... left join) を選ぶと、基準が Sales_Manager 側になり、販売地域に関連しないマネージャーの行が残ってしまいます。
手順 3 (順不同) → Merge [Sales_Region] and [Region_Manager] by using an inner join.
選択肢: Merge [Region_Manager] and [Manager] by using an inner join. / Merge [Sales_Manager] and [Sales_Region] by using a left join. / Merge [Sales_Region] and [Sales_Manager] by using an inner join. / Merge [Sales_Region] and [Sales_Manager] by using an inner join as a new query named [Sales_Region_and_Manager]. / Merge [Sales_Region] and [Region_Manager] by using a right join as a new query named [Sales_Region_and_Region_Manager]. / Merge [Sales_Region] and [Region_Manager] by using an inner join.
You have a Microsoft Power BI report. The size of PBIX file is 550 MB. The report is accessed by using an App workspace in shared capacity of powerbi.com. The report uses an imported dataset that contains one fact table. The fact table contains 12 million rows. The dataset is scheduled to refresh twice a day at 08:00 and 17:00. The report is a single page that contains 15 AppSource visuals and 10 default visuals. Users say that the report is slow to load the visuals when they access and interact with the report. You need to recommend a solution to improve the performance of the report. What should you recommend?
A. Change any DAX measures to use iterator functions.
B. Enable visual interactions.
C. Replace the default visuals with AppSource visuals.
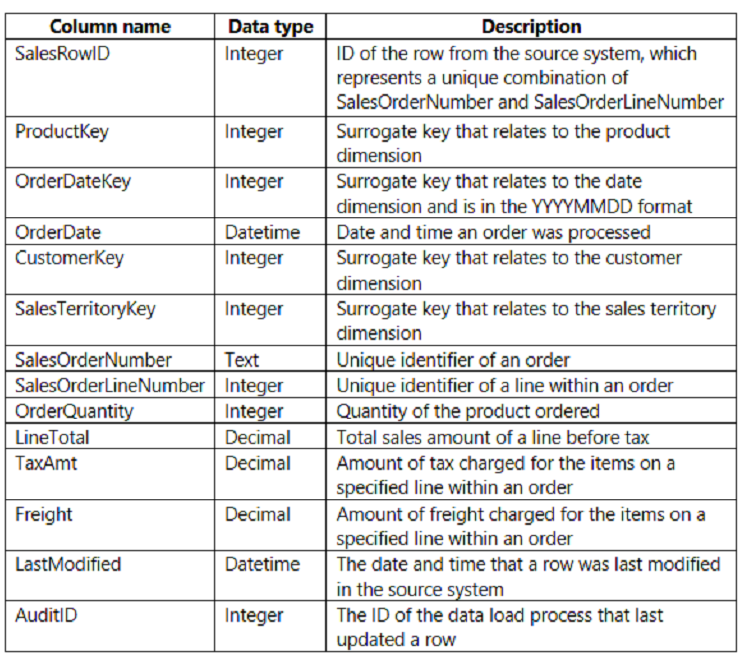
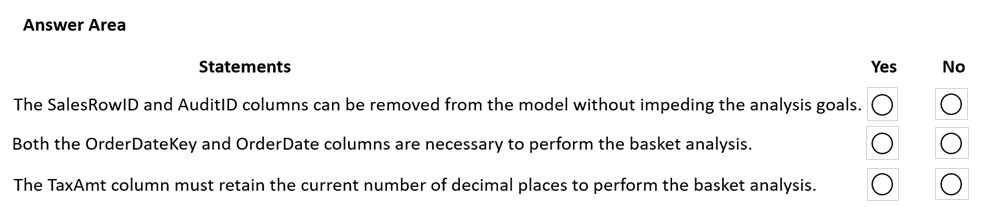
HOTSPOT - You are creating a Microsoft Power BI imported data model to perform basket analysis. The goal of the analysis is to identify which products are usually bought together in the same transaction across and within sales territories. You import a fact table named Sales as shown in the exhibit. (Click the Exhibit tab.) The related dimension tables are imported into the model. Sales contains the data shown in the following table. You are evaluating how to optimize the model. For each of the following statements, select Yes if the statement is true. Otherwise, select No. NOTE: Each correct selection is worth one point. Hot Area:
A. State Province の値が Kentucky であるか、または Calendar Year が 2020 のデータが表示される。
B. エラーが発生し、レポートのデータを表示できない。
C. State Province の値が Kentucky のデータのみが表示される。
D. State Province の値が Kentucky であり、かつ Calendar Year が 2020 のデータのみが表示される。
原文 (English) を表示
You have a Microsoft Power BI data model that contains three tables named Orders, Date, and City. There is a one-to-many relationship between Date and Orders and between City and Orders. The model contains two row-level security (RLS) roles named Role1 and Role2. Role1 contains the following filter. City[State Province] = "Kentucky" Role2 contains the following filter.
Date[Calendar Year] = 2020 - If a user is a member of both Role1 and Role2, what data will they see in a report that uses the model?
A. The user will see data for which the State Province value is Kentucky or where the Calendar Year is 2020.
B. The user will receive an error and will not be able to see the data in the report.
C. The user will only see data for which the State Province value is Kentucky.
D. The user will only see data for which the State Province value is Kentucky and the Calendar Year is 2020.
Microsoft Power BI を使用してデータをモデリングしています。データ モデルの一部は、1 億件を超えるレコードがある Order という名前の大きな Microsoft SQL Server テーブルです。 開発プロセス中に、Order テーブルからデータのサンプルをインポートする必要があります。 ソリューション: Power Query エディターで、テーブルをインポートしてから、クエリにフィルター ステップを追加します。 これは目標を達成していますか?
A. はい
B. いいえ
原文 (English) を表示
Note: This question is part of a series of questions that present the same scenario. Each question in the series contains a unique solution that might meet the stated goals. Some question sets might have more than one correct solution, while others might not have a correct solution. After you answer a question in this section, you will NOT be able to return to it. As a result, these questions will not appear in the review screen. You are modeling data by using Microsoft Power BI. Part of the data model is a large Microsoft SQL Server table named Order that has more than 100 million records. During the development process, you need to import a sample of the data from the Order table. Solution: From Power Query Editor, you import the table and then add a filter step to the query. Does this meet the goal?
Microsoft Power BI を使用してデータをモデリングしています。データ モデルの一部は、1 億件を超えるレコードがある Order という名前の大きな Microsoft SQL Server テーブルです。 開発プロセス中に、Order テーブルからデータのサンプルをインポートする必要があります。 ソリューション: FILTER 関数を使用する DAX 式を作成します。 これは目標を達成していますか?
A. はい
B. いいえ
原文 (English) を表示
Note: This question is part of a series of questions that present the same scenario. Each question in the series contains a unique solution that might meet the stated goals. Some question sets might have more than one correct solution, while others might not have a correct solution. After you answer a question in this section, you will NOT be able to return to it. As a result, these questions will not appear in the review screen. You are modeling data by using Microsoft Power BI. Part of the data model is a large Microsoft SQL Server table named Order that has more than 100 million records. During the development process, you need to import a sample of the data from the Order table. Solution: You write a DAX expression that uses the FILTER function. Does this meet the goal?
Microsoft Power BI を使用してデータをモデリングしています。データ モデルの一部は、1 億件を超えるレコードがある Order という名前の大きな Microsoft SQL Server テーブルです。 開発プロセス中に、Order テーブルからデータのサンプルをインポートする必要があります。 ソリューション: SQL ステートメントに WHERE 句を追加します。 これは目標を達成していますか?
A. はい
B. いいえ
原文 (English) を表示
Note: This question is part of a series of questions that present the same scenario. Each question in the series contains a unique solution that might meet the stated goals. Some question sets might have more than one correct solution, while others might not have a correct solution. After you answer a question in this section, you will NOT be able to return to it. As a result, these questions will not appear in the review screen. You are modeling data by using Microsoft Power BI. Part of the data model is a large Microsoft SQL Server table named Order that has more than 100 million records. During the development process, you need to import a sample of the data from the Order table. Solution: You add a WHERE clause to the SQL statement. Does this meet the goal?
A. Yes
B. No
解答: A
ポイント: 本シリーズの正解の回です。データ取得時の SQL ステートメントに WHERE 句を書けば、絞り込みは SQL Server 側で実行され、条件に合うサンプル行だけが Power BI に返されます。「取り込む前にソースで絞る」が 1 億行テーブルへの正攻法です。
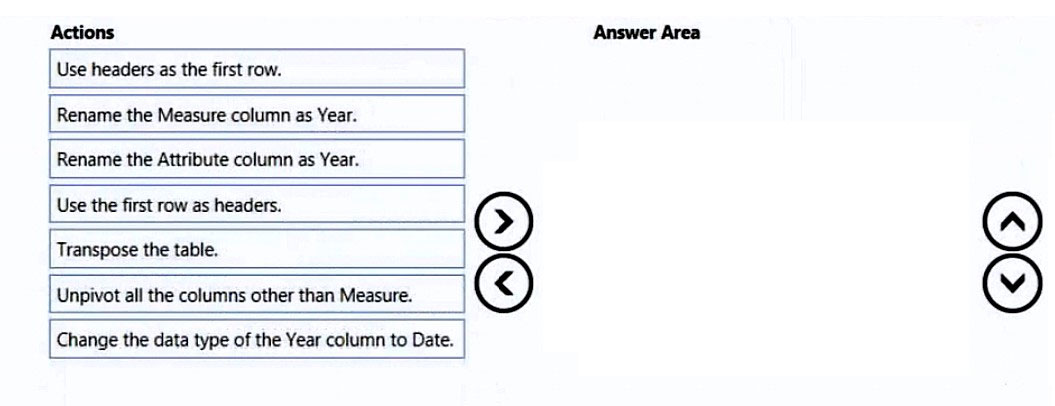
DRAG DROP - You are preparing a financial report in Power BI. You connect to the data stored in a Microsoft Excel spreadsheet by using Power Query Editor as shown in the following exhibit. You need to prepare the data to support the following: ✑ Visualizations that include all measures in the data over time ✑ Year-over-year calculations for all the measures Which four actions should you perform in sequence? To answer, move the appropriate actions from the list of actions to the answer area and arrange them in the correct order. Select and Place:
解答: Use the first row as headers. / Unpivot all the columns other than Measure. / Rename the Attribute column as Year. / Change the data type of the Year column to Date.
選択肢: Use headers as the first row. / Rename the Measure column as Year. / Rename the Attribute column as Year. / Use the first row as headers. / Transpose the table. / Unpivot all the columns other than Measure. / Change the data type of the Year column to Date.
展示 (画像) では列名が Column1〜Column6 で、1 行目に Measure、2016〜2020 という本来のヘッダーがデータとして入っています。まず [1 行目をヘッダーとして使用] で列名に昇格させます。逆操作の「Use headers as the first row (ヘッダーを 1 行目として使用)」と間違えないよう注意。
手順 2 → Unpivot all the columns other than Measure.
選択肢: Use headers as the first row. / Rename the Measure column as Year. / Rename the Attribute column as Year. / Use the first row as headers. / Transpose the table. / Unpivot all the columns other than Measure. / Change the data type of the Year column to Date.
選択肢: Use headers as the first row. / Rename the Measure column as Year. / Rename the Attribute column as Year. / Use the first row as headers. / Transpose the table. / Unpivot all the columns other than Measure. / Change the data type of the Year column to Date.
ピボット解除で自動生成された Attribute 列の名前を Year に変更します。Measure 列は指標名 (Revenue など) の列なので、「Measure 列を Year に変更する」選択肢は誤りです。
手順 4 → Change the data type of the Year column to Date.
選択肢: Use headers as the first row. / Rename the Measure column as Year. / Rename the Attribute column as Year. / Use the first row as headers. / Transpose the table. / Unpivot all the columns other than Measure. / Change the data type of the Year column to Date.
根拠: 「すべてのメジャーの前年比の計算」
Year 列のデータ型を日付に変換します。前年比の計算に使うタイム インテリジェンス関数や日付階層は、連続した日付型の列を前提とするためです。
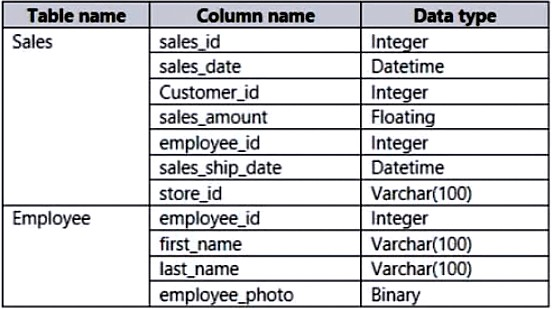
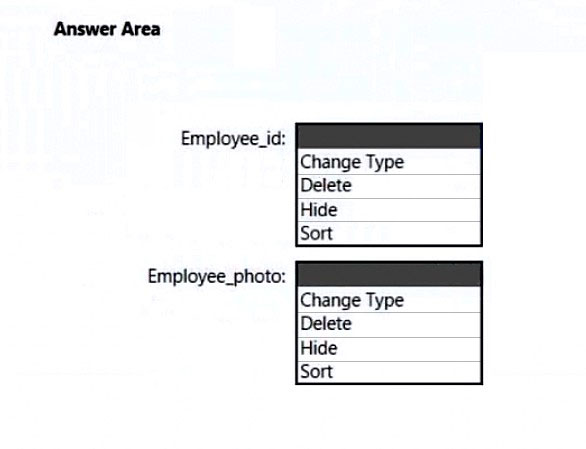
HOTSPOT - You are creating an analytics report that will consume data from the tables shown in the following table. There is a relationship between the tables. There are no reporting requirements on employee_id and employee_photo. You need to optimize the data model. What should you configure for employee_id and employee_photo? To answer, select the appropriate options in the answer area. NOTE: Each correct selection is worth one point. Hot Area:
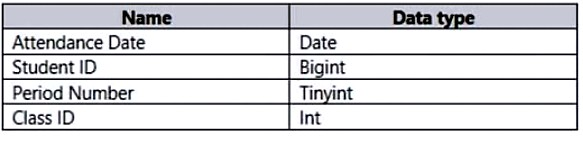
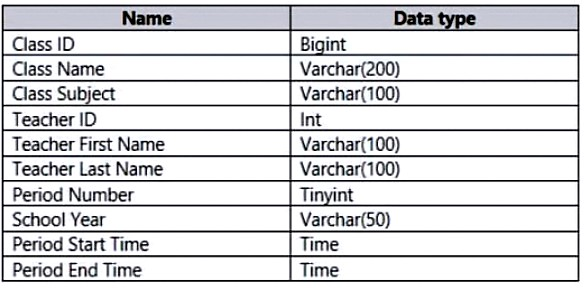
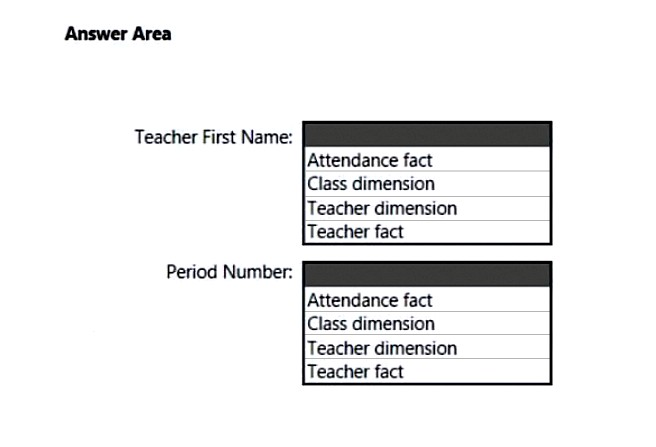
ホットスポット - 学校の出席状況を分析するための Power BI データセットを作成することを計画しています。データは、Azure SQL データベース内の View1 と View2 という名前の 2 つの別々のビューから取得されます。 View1 には、次の表に示す列が含まれています。 View2 には、次の表に示す列が含まれています。 ビューは Class ID 列に基づいて関連付けることができます。 Class ID は、特定のクラス、時限、教師、学年度の一意の識別子です。たとえば、同じクラスを同じ教師が 2 つの異なる時限に教える場合がありますが、そのクラスには異なるクラス ID が付けられます。 両方のビューのデータを使用して、スター スキーマのデータ モデルを設計する必要があります。ソリューションでは、次の分析を容易にする必要があります: ✑ 時限ごとに行われるクラスの数 ✑ 日ごと、時限ごとの出席学生数 ✑ 毎月クラスに出席する学生の平均数 Teacher First Name フィールドと Period Number フィールドをどのテーブルに含めるべきでしょうか。回答するには、回答エリアで適切なオプションを選択してください。 注: 正しい選択はそれぞれ 1 ポイントの価値があります。 ホット エリア:
原文 (English) を表示
HOTSPOT - You plan to create Power BI dataset to analyze attendance at a school. Data will come from two separate views named View1 and View2 in an Azure SQL database. View1 contains the columns shown in the following table. View2 contains the columns shown in the following table. The views can be related based on the Class ID column. Class ID is the unique identifier for the specified class, period, teacher, and school year. For example, the same class can be taught by the same teacher during two different periods, but the class will have a different class ID. You need to design a star schema data model by using the data in both views. The solution must facilitate the following analysis: ✑ The count of classes that occur by period ✑ The count of students in attendance by period by day ✑ The average number of students attending a class each month In which table should you include the Teacher First Name and Period Number fields? To answer, select the appropriate options in the answer area. NOTE: Each correct selection is worth one point. Hot Area:
解答: Teacher dimension / Class dimension
ポイント: スター スキーマでは、出席の記録 (View1) がファクト、それを説明する属性がディメンションです。「名前」のような説明的なテキスト属性はファクトには置きません。Teacher First Name は教師というエンティティの属性なので Teacher ディメンションへ、Period Number はクラス (Class ID は時限まで含めて一意) の属性なので Class ディメンションへ入れます。
Teacher First Name → Teacher dimension → Teacher dimension
Class ID は「クラス・時限・教師・学年度」の組み合わせごとに一意と定義されているため、時限は各クラスに固定の属性です。Class ディメンションに置けば、「時限ごとのクラス数」は Class ディメンション単独で数えられ、「日ごと・時限ごとの出席学生数」も Class ID のリレーションシップ経由で出席ファクトを集計して求められます。時限は教師の属性ではないので Teacher ディメンションは誤りです。
Question 80 (Topic 2 / #22) mc
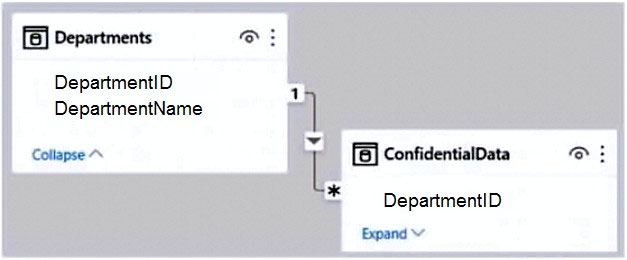
次の展示に示す Power BI モデルがあります。 Departments テーブルには 4 つの部署があります。 ユーザーが自分の部署のデータのみを表示できるようにする必要があります。 何をすべきでしょうか。
A. DepartmentID に基づいて Departments をフィルター処理するスライサーを作成する。
B. 部署ごとに行レベル セキュリティ (RLS) ロールを作成し、ロールのメンバーシップを定義する。
C. Departments テーブルをフィルター処理する DepartmentID パラメーターを作成する。
D. ConfidentialData テーブルに、CURRENTGROUP DAX 関数を使用する計算メジャーを追加する。
原文 (English) を表示
You have the Power BI model shown in the following exhibit. There are four departments in the Departments table. You need to ensure that users can see the data of their respective department only. What should you do?
A. Create a slicer that filters Departments based on DepartmentID.
B. Create a row-level security (RLS) role for each department, and then define the membership of the role.
C. Create a DepartmentID parameter to filter the Departments table.
D. To the ConfidentialData table, add a calculated measure that uses the CURRENTGROUP DAX function.
Power BI Desktop で、2 つのテーブルを含む販売レポートを作成しています。両方のテーブルには行レベル セキュリティ (RLS) が構成されています。 テーブル間にリレーションシップを作成する必要があります。ソリューションでは、双方向のクロス フィルタリングで RLS の設定が確実に適用されるようにする必要があります。 何をすべきでしょうか。
A. テーブル間に非アクティブなリレーションシップを作成し、[双方向にセキュリティ フィルターを適用する] を選択する。
B. テーブル間にアクティブなリレーションシップを作成し、[双方向にセキュリティ フィルターを適用する] を選択する。
C. テーブル間に非アクティブなリレーションシップを作成し、[参照整合性を想定] を選択する。
D. テーブル間にアクティブなリレーションシップを作成し、[参照整合性を想定] を選択する。
原文 (English) を表示
In Power BI Desktop, you are building a sales report that contains two tables. Both tables have row-level security (RLS) configured. You need to create a relationship between the tables. The solution must ensure that bidirectional cross-filtering honors the RLS settings. What should you do?
A. Create an inactive relationship between the tables and select Apply security filter in both directions.
B. Create an active relationship between the tables and select Apply security filter in both directions.
C. Create an inactive relationship between the tables and select Assume referential integrity.
D. Create an active relationship between the tables and select Assume referential integrity.
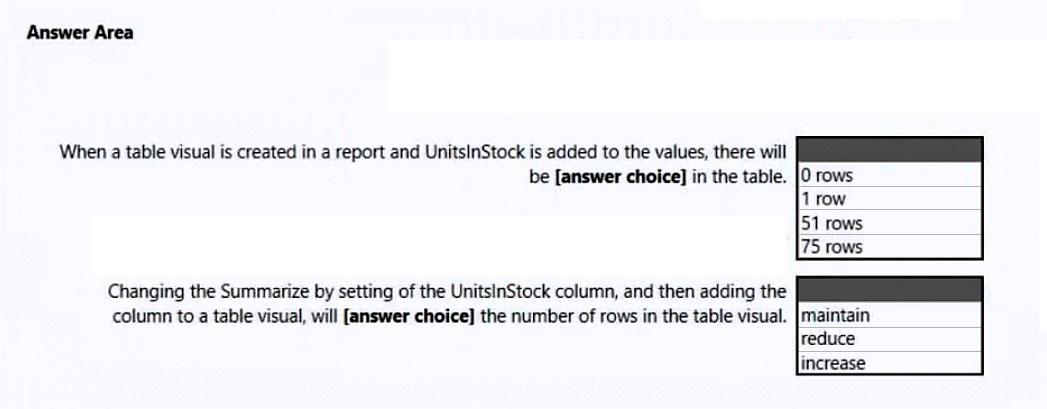
HOTSPOT - You have a column named UnitsInStock as shown in the following exhibit. UnitsInStock has 75 non-null values, of which 51 are unique. Use the drop-down menus to select the answer choice that completes each statement based on the information presented in the graphic. NOTE: Each correct selection is worth one point. Hot Area:
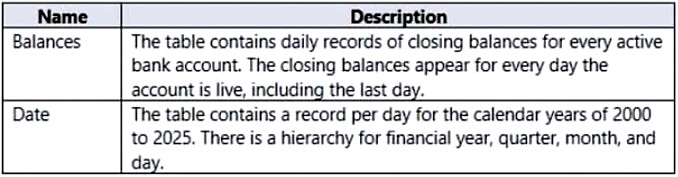
HOTSPOT - You have a Power BI report. You have the following tables. You have the following DAX measure. Accounts := CALCULATE ( DISTINCTCOUNT (Balances[AccountID]), LASTDATE ('Date'[Date]) For each of the following statements, select Yes if the statement is true. Otherwise, select No. NOTE: Each correct selection is worth one point. Hot Area:
B. Power Query で Impressions クエリを Ad_id、Site_name、Impression_date でグループ化する。CountRows 関数を使用して集計する。
C. Ad_id、Site_name、Impression_date を含む計算テーブルを作成する。
D. COUNTROWS 関数を使用して集計する計算メジャーを作成する。
原文 (English) を表示
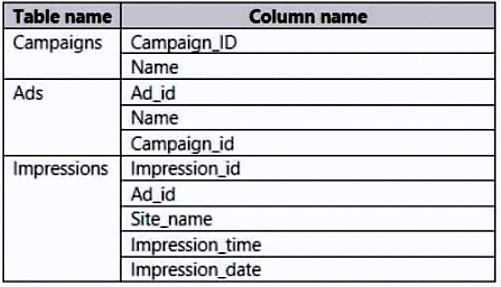
You have the tables shown in the following table. The Impressions table contains approximately 30 million records per month. You need to create an ad analytics system to meet the following requirements: ✑ Present ad impression counts for the day, campaign, and site_name. The analytics for the last year are required. Minimize the data model size. Which two actions should you perform? Each correct answer presents part of the solution. NOTE: Each correct selection is worth one point.
A. Create one-to-many relationships between the tables.
B. Group the Impressions query in Power Query by Ad_id, Site_name, and Impression_date. Aggregate by using the CountRows function.
C. Create a calculated table that contains Ad_id, Site_name, and Impression_date.
D. Create a calculated measure that aggregates by using the COUNTROWS function.
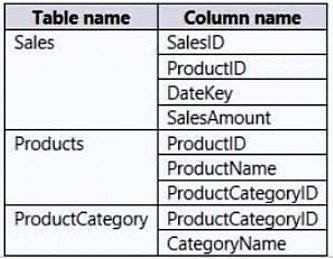
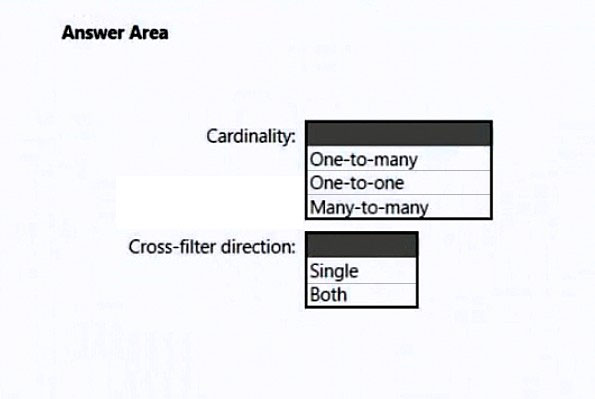
ホットスポット - 次の表に示すテーブルを持つ Microsoft Power BI データ モデルを作成しています。 Products テーブルは、ProductCategoryID 列を介して ProductCategory テーブルに関連付けられています。各製品には 1 つの製品カテゴリがあります。 製品カテゴリ別に売上を分析できるようにする必要があります。 ProductCategory から Products へのリレーションシップをどのように構成すべきでしょうか。回答するには、回答エリアで適切なオプションを選択してください。 注: 正しい選択はそれぞれ 1 ポイントの価値があります。 ホット エリア:
原文 (English) を表示
HOTSPOT - You are creating a Microsoft Power BI data model that has the tables shown in the following table. The Products table is related to the ProductCategory table through the ProductCategoryID column. Each product has one product category. You need to ensure that you can analyze sales by product category. How should you configure the relationship from ProductCategory to Products? To answer, select the appropriate options in the answer area. NOTE: Each correct selection is worth one point. Hot Area:
次のテーブルを含む Power BI データセットをインポートします: ✑ Date ✑ Product ✑ Product Inventory Product Inventory テーブルには 2,500 万行が含まれています。データのサンプルを次の表に示します。 Product Inventory テーブルは、DateKey 列を使用して Date テーブルに関連付けられています。Product Inventory テーブルは、ProductKey 列を使用して Product テーブルに関連付けられています。 情報を失うことなく、データ モデルのサイズを縮小する必要があります。 何をすべきでしょうか。
A. DateKey の Summarization (集計) を Don't Summarize (集計しない) に変更する。
B. Date と Product Inventory の間のリレーションシップを削除する
C. UnitCost のデータ型を整数に変更する。
D. MovementDate を削除する。
原文 (English) を表示
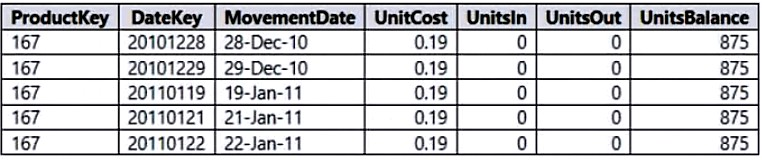
You import a Power BI dataset that contains the following tables: ✑ Date ✑ Product ✑ Product Inventory The Product Inventory table contains 25 million rows. A sample of the data is shown in the following table. The Product Inventory table relates to the Date table by using the DateKey column. The Product Inventory table relates to the Product table by using the ProductKey column. You need to reduce the size of the data model without losing information. What should you do?
A. Change Summarization for DateKey to Don't Summarize.
B. Remove the relationship between Date and Product Inventory
ホットスポット - DAX 計算を含む Power BI モデルを強化しています。 前の暦年の同じ日付までの年初来売上合計を返すメジャーを作成する必要があります。 どの DAX 関数を使用すべきでしょうか。回答するには、回答エリアで適切なオプションを選択してください。 注: 正しい選択はそれぞれ 1 ポイントの価値があります。 ホット エリア:
原文 (English) を表示
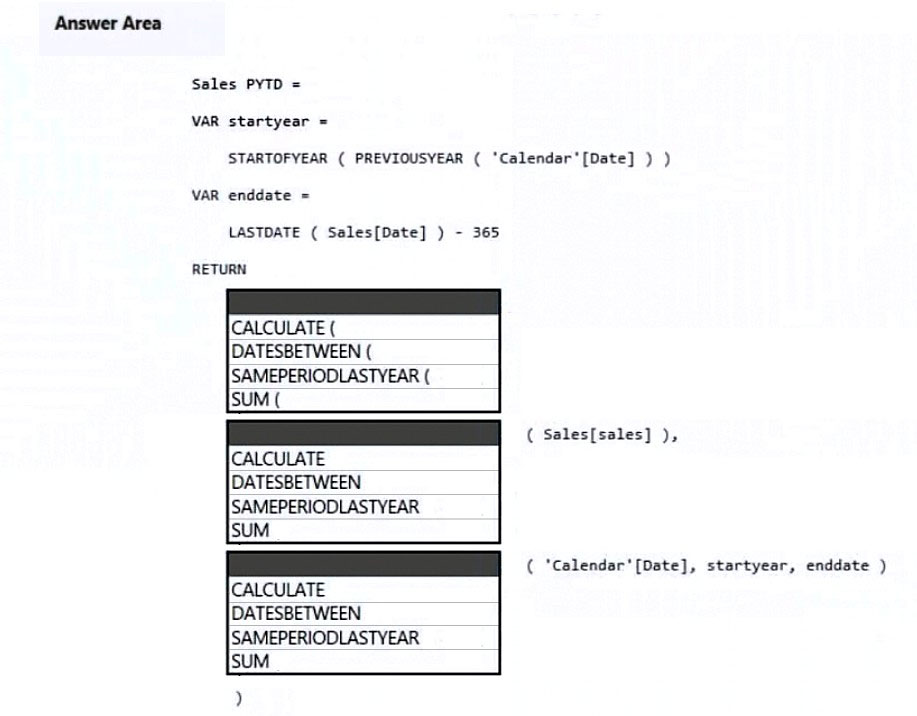
HOTSPOT - You are enhancing a Power BI model that has DAX calculations. You need to create a measure that returns the year-to-date total sales from the same date of the previous calendar year. Which DAX functions should you use? To answer, select the appropriate options in the answer area. NOTE: Each correct selection is worth one point. Hot Area:
Microsoft Power BI を使用してデータをモデリングしています。データ モデルの一部は、1 億件を超えるレコードがある Order という名前の大きな Microsoft SQL Server テーブルです。 開発プロセス中に、Order テーブルからデータのサンプルをインポートする必要があります。 ソリューション: 注文日に基づいてフィルター処理するレポート レベル フィルターを追加します。 これは目標を達成していますか?
A. はい
B. いいえ
原文 (English) を表示
Note: This question is part of a series of questions that present the same scenario. Each question in the series contains a unique solution that might meet the stated goals. Some question sets might have more than one correct solution, while others might not have a correct solution. After you answer a question in this section, you will NOT be able to return to it. As a result, these questions will not appear in the review screen. You are modeling data by using Microsoft Power BI. Part of the data model is a large Microsoft SQL Server table named Order that has more than 100 million records. During the development process, you need to import a sample of the data from the Order table. Solution: You add a report-level filter that filters based on the order date. Does this meet the goal?
Introductory Info
Case Study - This is a case study. Case studies are not timed separately. You can use as much exam time as you would like to complete each case. However, there may be additional case studies and sections on this exam. You must manage your time to ensure that you are able to complete all questions included on this exam in the time provided. To answer the questions included in a case study, you will need to reference information that is provided in the case study. Case studies might contain exhibits and other resources that provide more information about the scenario that is described in the case study. Each question is independent of the other questions in this case study. At the end of this case study, a review screen will appear. This screen allows you to review your answers and to make changes before you move to the next section of the exam. After you begin a new section, you cannot return to this section.
To start the case study - To display the first question in this case study, click the Next button. Use the buttons in the left pane to explore the content of the case study before you answer the questions. Clicking these buttons displays information such as business requirements, existing environment and problem statements. If the case study has an All Information tab, note that the information displayed is identical to the information displayed on the subsequent tabs. When you are ready to answer a question, click the Question button to return to the question.
Overview - Litware, Inc. is an online retailer that uses Power BI. Litware plans to leverage data from an Azure SQL database that stores data for the company's live e-commerce website. Litware uses Azure Active Directory (Azure AD) to authenticate users. Existing Environment. Sales Data Litware has online sales data that has the SQL schema shown in the following table. In the Date table, the date_id column has a format of yyyymmdd and the month column has a format of yyyymm. The week column in the Date table and the week_id column in the Weekly_Returns table have a format of yyyyww. In the Sales table, the sales_id column represents a unique transaction. The region id column can be managed by only one sales manager. Existing Environment. Data Concerns You are concerned with the quality and completeness of the sales data. You must ensure that negative and missing sales_amount values do NOT contribute to the total sales amount calculation. Existing Environment. Reporting Requirements Litware identifies the following reporting requirements: Executives require a visual that shows sales by region. Executives require a visual that shows returns by region manager and the sales managers that report to them. The sales managers must be able to see only the sales data of their respective region. The sales managers require a visual to analyze sales performance versus sales targets. The sales department requires reports that contain the number of sales transactions. Users must be able to see the month in each report as shown in the following example: Feb 2020. The customer service department requires a visual that can be filtered by both sales month and ship month independently. The maximum allowed latency to include transactions in reports is five minutes.
Question
You need to create the required relationship for the executive's visual. What should you do before you can create the relationship?
A. Change the data type of Sales[region_id] to Whole Number.
B. Change the data type of Sales[region_id] to Decimal Number.
C. In the Sales table, add a measure for Sum(sales_amount).
D. Change the data type of Sales[sales_id] to Text.
Introductory Info
Case Study - This is a case study. Case studies are not timed separately. You can use as much exam time as you would like to complete each case. However, there may be additional case studies and sections on this exam. You must manage your time to ensure that you are able to complete all questions included on this exam in the time provided. To answer the questions included in a case study, you will need to reference information that is provided in the case study. Case studies might contain exhibits and other resources that provide more information about the scenario that is described in the case study. Each question is independent of the other questions in this case study. At the end of this case study, a review screen will appear. This screen allows you to review your answers and to make changes before you move to the next section of the exam. After you begin a new section, you cannot return to this section.
To start the case study - To display the first question in this case study, click the Next button. Use the buttons in the left pane to explore the content of the case study before you answer the questions. Clicking these buttons displays information such as business requirements, existing environment and problem statements. If the case study has an All Information tab, note that the information displayed is identical to the information displayed on the subsequent tabs. When you are ready to answer a question, click the Question button to return to the question.
Overview - Contoso, Ltd. is a manufacturing company that produces sports equipment. Contoso holds quarterly board meetings for which financial analysts manually prepare Microsoft Excel reports, including balance sheets and profit and loss statements for each of the company's four business units.
Existing Environment -
Data and Sources - Data for the reports comes from the sources shown in the following table. The balance sheet data is unrelated to the profit and loss results other than they both relate to dates.
Balance Sheet Data - The balance sheet data is imported and includes the final monthly balances of each account in the format shown in the following table. The balance sheet data always includes a row for each account for each month.
Product Catalog Data - The product catalog shows how products roll up to product categories, which roll up to the business units. The product list is provided in the format shown in the following table. Revenue data is provided at the date and product level. Expense data is provided at the date and department level.
Business Issues - Historically, it has taken two analysts a week to prepare the reports for the quarterly board meetings. Also, there is usually at least one issue each quarter where a value in a report is wrong because of a bad cell reference in an Excel formula. On occasion, there are conflicting results in the reports because the products and departments that roll up to each business unit are not defined consistently.
Requirements -
Planned Changes - Contoso plans to automate and standardize the quarterly reporting process by using Power BI. The company wants to reduce how long it takes to populate the reports to less than two days. The company wants to create common logic for the business units, products, and departments. The logic will be used across all reports, including but not limited to the quarterly reporting for the board.
Technical Requirements - Contoso wants the reports and datasets refreshed with minimum manual effort. The company wants to provide the board with a single package of reports that will contain custom navigation and links to supplementary information. Maintenance, including manually updating data and access, must be minimized as much as possible.
Security Requirements - The reports must be made available to the board from powerbi.com. An Azure Active Directory (Azure AD) group will be used to share information with the board. Contoso identifies the following security requirements for analyst access: Analysts must be able to access all balance sheet and product catalog data. Analysts must be able to access only the profit and loss data of their respective business unit. Analysts must be able to create new reports from the dataset that contains the profit and loss data, but the reports built by the analysts must NOT be included in the quarterly reports for the board. Analysts must NOT be able to share the quarterly reports with anyone. Analysts must NOT be able to make new reports by using the balance sheet data.
Report Requirements - You plan to relate the balance sheet table to a date table in Power BI in a many-to-one relationship based on the last day of the month. At least one of the balance sheet reports in the quarterly reporting package must show the ending balances for the quarter, as well as for the previous quarter. The date table will contain the columns shown in the following table. The definitions and attributes for the products, departments, and business units must be consistent across all the reports. The board must be able to get the following information from the quarterly reports: Revenue trends over time The ending balances of each account Changes in long-term liabilities from the previous quarter The percent of total revenue contributed by each product category A comparison of quarterly revenue versus the same quarter from the previous year The reports must be updated with the latest data by 5 AM each day.
Question
HOTSPOT - You need to create a measure that returns the percent of revenue by product category. How should you complete the measure? To answer, select the appropriate options in the answer area. NOTE: Each correct selection is worth one point. Hot Area: